Category: AI-Assisted

  • AI Visual Inspection in Manufacturing

    AI Visual Inspection in Manufacturing

    On a production line running at full speed, a human inspector has a fraction of a second to assess each unit passing in front of them. The result is an inspection process that is inconsistent at best and unreliable at worst, and in high-volume manufacturing, even a 1% defect escape rate translates into thousands of non-conforming units reaching customers, triggering returns, warranty claims, and reputational damage that costs far more than the defects themselves.

    AI visual inspection in manufacturing addresses this problem directly. By replacing or augmenting human visual checks with machine vision systems powered by artificial intelligence, manufacturers achieve inspection speeds, consistency, and accuracy that no human team can match, at every unit, on every shift, without variation.

    What Is AI Visual Inspection?

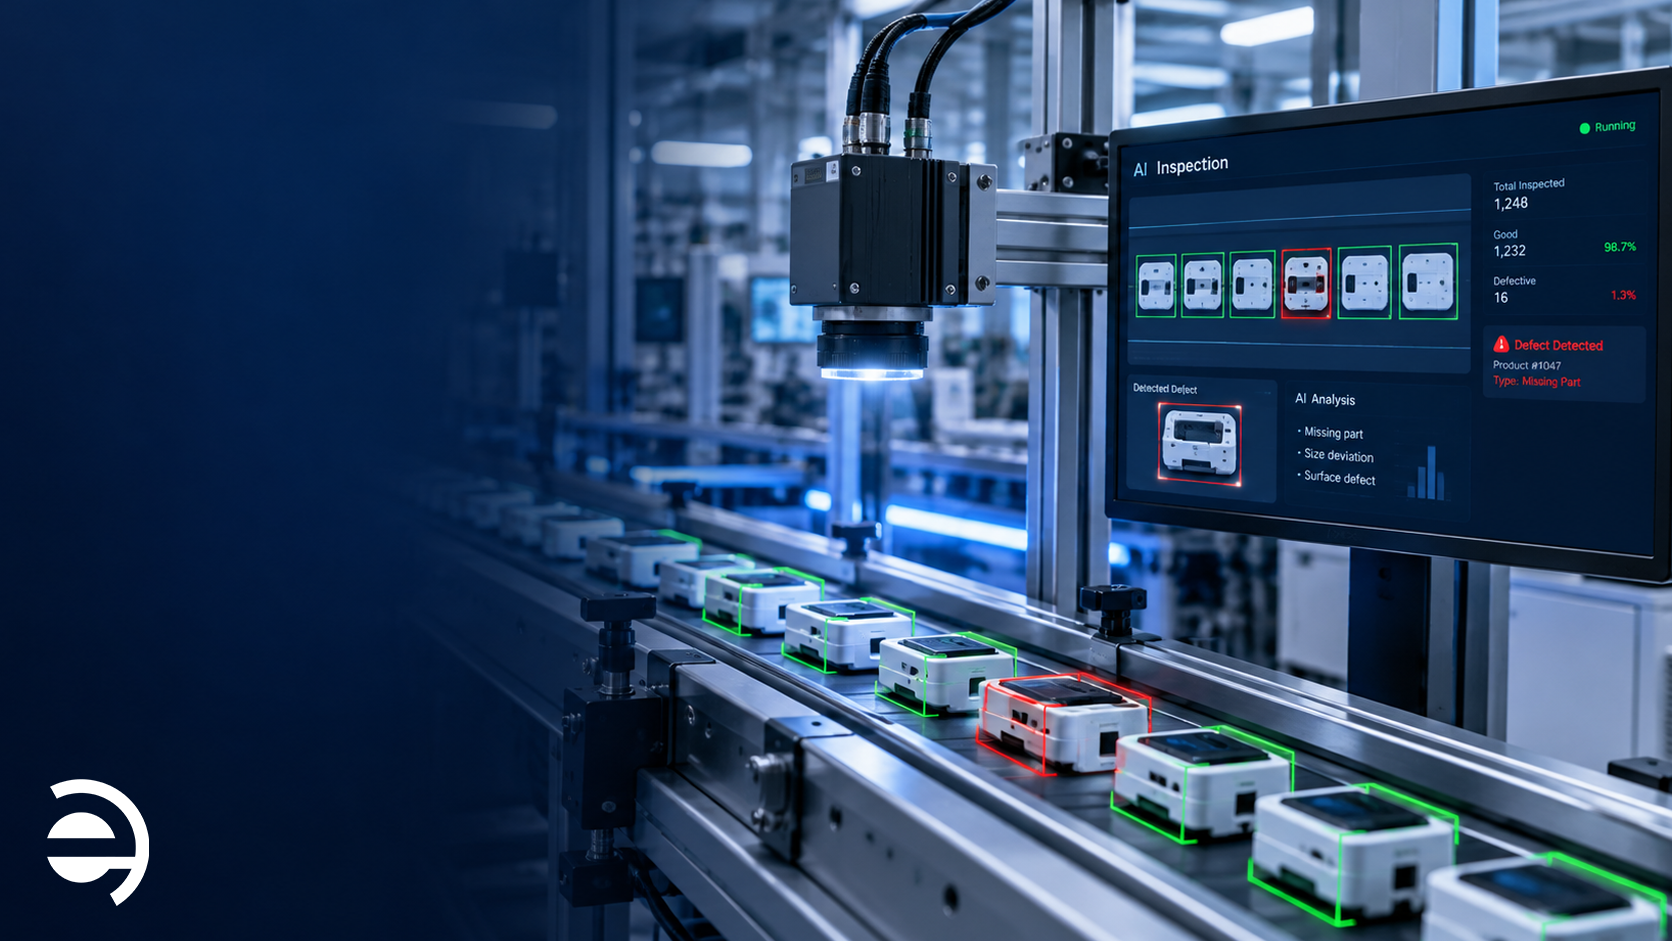
    AI visual inspection is the use of cameras, lighting systems, and artificial intelligence algorithms to automatically detect defects, anomalies, and non-conformities in manufactured products, in real time, at production line speed, without human intervention at the point of inspection.

    Unlike traditional rule-based machine vision, which relied on fixed thresholds and pre-programmed templates, modern AI visual inspection manufacturing systems use deep learning models trained on thousands of images of conforming and non-conforming parts. These models learn to recognize defects the way an experienced human inspector does: by pattern recognition across a wide range of visual characteristics, not by checking a fixed set of parameters.

    The result is an inspection system that improves over time as it processes more data, adapts to new product variants without complete reprogramming, and catches subtle defects that rule-based systems miss entirely.

    How Machine Vision Catches Defects
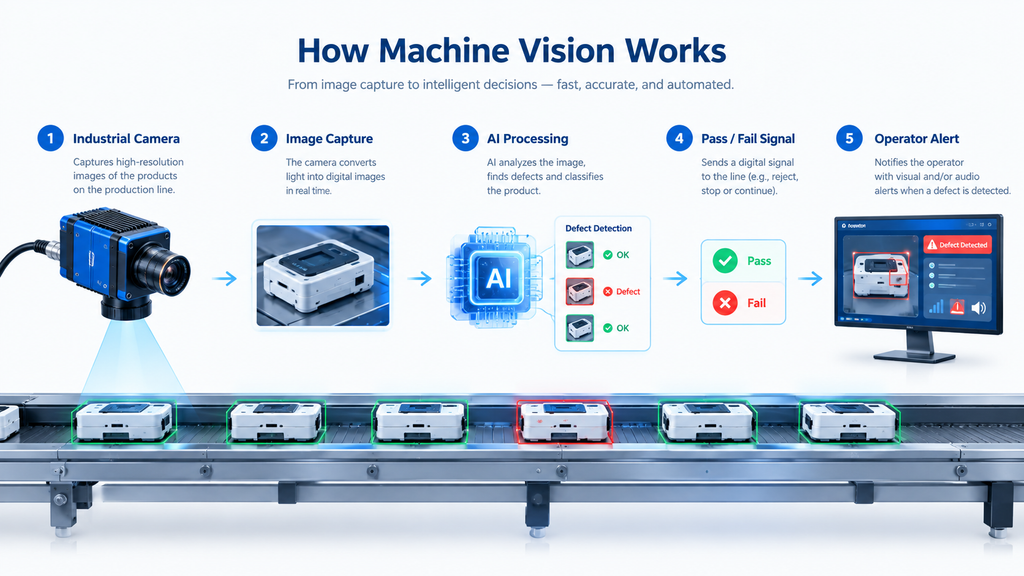
    A complete machine vision system for manufacturing defect detection operates through four stages:

    Stage 1 — Image Acquisition

    Industrial cameras, line scan or area scan, all which depend on the application, capture high-resolution images of every unit as it passes through the inspection station. Controlled lighting is critical at this stage: consistent, calibrated illumination eliminates shadows and reflections that would otherwise create false positives or mask genuine defects. Inspection speeds of hundreds of units per minute are achievable with the right camera and lighting configuration.

    Stage 2 — AI Processing

    Each captured image is passed in real time to the AI quality control algorithm like a deep learning model that has been trained on labeled image datasets showing both conforming parts and specific defect types. The model analyzes the image for deviations from the learned baseline: surface anomalies, dimensional variations, color inconsistencies, missing components, or assembly errors.

    This processing happens in milliseconds, which is fast enough to keep pace with production line speeds and deliver a decision before the unit reaches the next station.

    Stage 3 — Pass / Fail Decision

    The AI model outputs a confidence score for each conforming unit, or non-conforming, with the specific defect type and location identified and marked on the image. Units that fall below the conformance threshold are flagged for rejection or diversion to a secondary inspection station. The decision is logged with a timestamp, image capture, and defect classification for full traceability.

    Stage 4 — Alert and Reporting

    When defect rates exceed defined thresholds that signals a process drift, material batch issue, or equipment problem, and the automated defect detection system triggers an alert to the production supervisor. Rather than discovering a quality problem at the end of a shift through sampling, the team is notified in real time and can intervene before the issue propagates through the production run.

    What AI Visual Inspection Detects
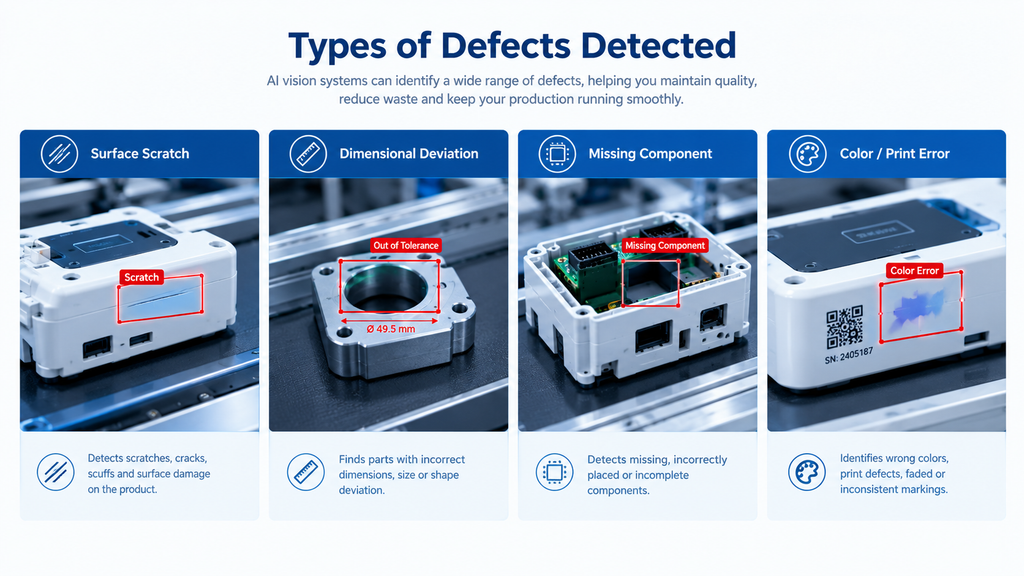
    Computer vision quality control systems can be trained to detect a wide range of defect types across different manufacturing environments:

    • Surface defects: scratches, dents, cracks, pitting, corrosion, and surface contamination on metal, plastic, glass, and ceramic components
    • Dimensional deviations: parts that fall outside specified tolerances for length, width, diameter, or height, detected through precise pixel-level measurement
    • Missing components: absent fasteners, labels, connectors, or sub-assemblies that should be present at a given production stage
    • Color and print defects: incorrect color, faded or misaligned printing, barcode readability failures, and label placement errors
    • Assembly errors: incorrect component orientation, reversed polarity, mis-seated connectors, and incomplete sub-assembly
    • Weld and solder quality: void detection, cold joints, bridging, and insufficient coverage in welding and soldering applications

    The specific defect types a system is trained to detect depend on the product and process, a machine vision system for PCB inspection has a very different training dataset from one deployed for automotive body panel inspection. This is why training data quality and domain expertise in the inspection application are as important as the AI algorithm itself.

    Where AI Visual Inspection Is Used in Manufacturing

    AI visual inspection manufacturing applications span a wide range of industries and production environments:

    • Electronics and PCB manufacturing: solder joint inspection, component placement verification, and conformal coating coverage
    • Automotive: body panel surface inspection, weld quality, interior assembly verification, and paint defect detection
    • Food and beverage packaging: fill level, seal integrity, label placement, and date code legibility
    • Pharmaceutical: tablet and capsule integrity, blister pack completeness, and label accuracy under strict regulatory traceability requirements
    • Metal fabrication: surface finish inspection, dimensional conformance, and weld quality on structural components
    • Consumer electronics: housing surface quality, display panel inspection, and connector alignment

    AI Visual Inspection vs. Traditional Quality Control

    The advantages of AI visual inspection over traditional human and rule-based inspection methods are significant, particularly at scale:

    Human InspectionRule-Based VisionAI Visual Inspection
    SpeedLimited by human reaction timeFast but inflexibleFast and adaptive
    ConsistencyDegrades with fatigueConsistent within fixed rulesConsistent across all conditions
    Defect rangeBroad but variableNarrow, pre-programmed onlyBroad and expanding with training
    New product variantsRetrainable but slowRequires full reprogrammingAdaptable with incremental retraining
    TraceabilityManual logsAutomatedFully automated with image archive

    For high-volume production environments where quality consistency and traceability are non-negotiable, automated defect detection through AI visual inspection is not simply a productivity tool; but it is a quality management infrastructure investment.

    The Role of Industrial IoT in AI Visual Inspection

    AI visual inspection systems do not operate in isolation. In a connected manufacturing environment, they form part of a broader industrial IoT solutions architecture which shares data with production management systems, quality management platforms, and environmental monitoring infrastructure.

    When an AI inspection system detects a spike in defect rates, that signal can be correlated with environmental monitoring data, temperature variations in the production area, humidity changes that affect material properties, or vibration anomalies from equipment, to identify the root cause rather than simply flagging the symptom. This integration of computer vision quality control with environmental and operational IoT data is what transforms inspection from a reactive process into a predictive one.

    Contact our team today to discuss your inspection requirements and receive a tailored solution recommendation.
  • Energy Management Software: What It Is and How It Works

    Energy Management Software: What It Is and How It Works

    Energy is one of the largest controllable costs in any commercial or industrial facility; yet for most organizations, it remains one of the least visible. Electricity is consumed continuously across dozens of systems and hundreds of devices, but without the right tools, the data generated by that consumption never reaches the people who could act on it. Energy management software changes that turns raw consumption data into actionable intelligence that facility managers, operations directors, and sustainability teams can use to reduce costs, improve efficiency, and meet the growing compliance demands of regulators across the Middle East and beyond.

    This guide explains what energy management software is, how it works, what it monitors, and what to look for when selecting a platform for your facility.

    What Is Energy Management Software?

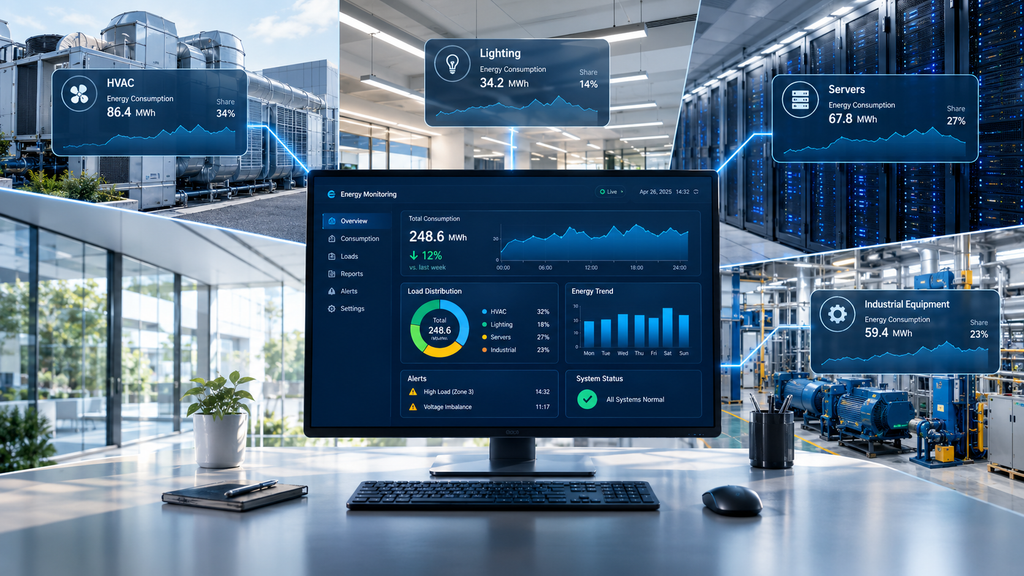
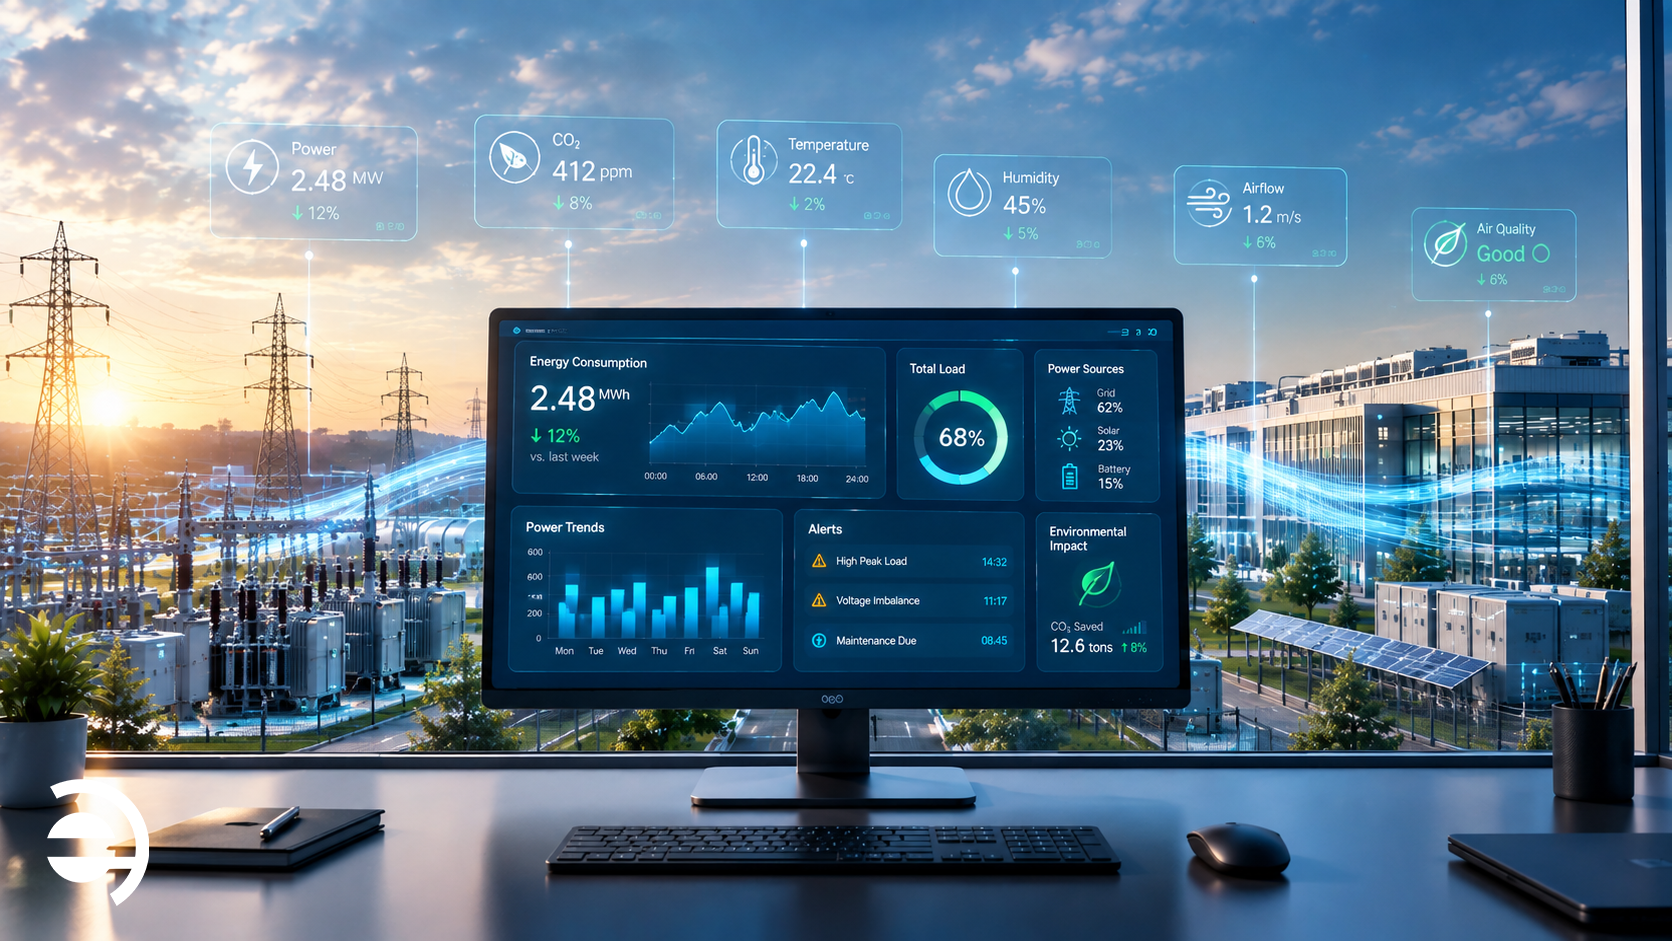
    Energy management software (EMS) is a platform that collects, processes, and presents energy consumption data from across a facility or portfolio of buildings which gives operations teams real-time and historical visibility over how energy is being used, where it is being wasted, and what can be done to reduce consumption without compromising operations.

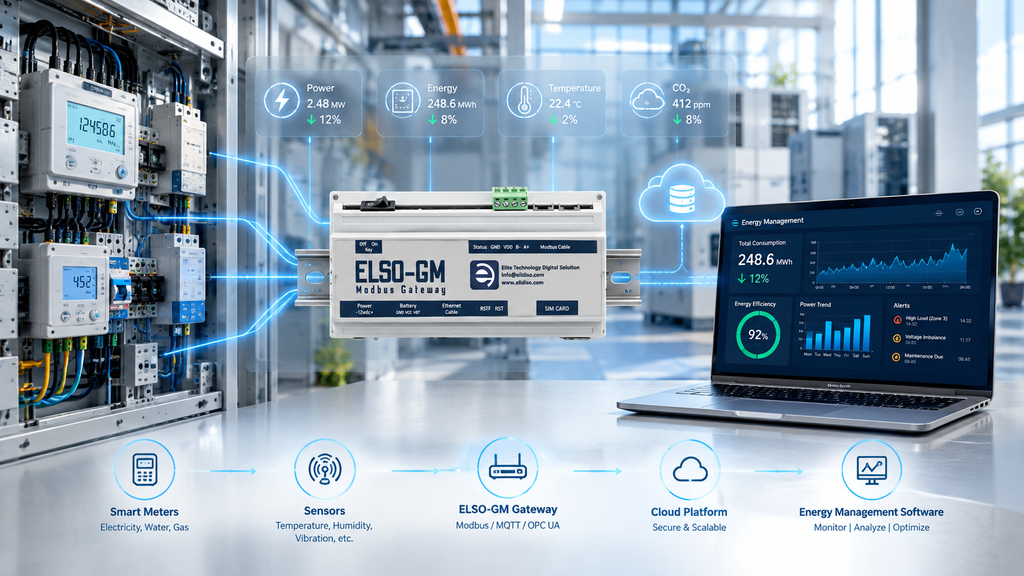
    At its core, an energy management system connects to the electrical infrastructure of a facility through smart meters, current sensors, voltage monitors, and IoT gateways, and aggregates the resulting data into a centralized dashboard. From that dashboard, facility teams can monitor live consumption, review historical trends, set alerts for abnormal usage, and generate the compliance reports that regulators and auditors require.

    The distinction between basic metering and a true EMS software platform lies in what happens to the data after it is collected. A smart meter tells you how much energy you used. Energy management software tells you which system used it, when the peak occurred, whether that pattern is normal, and what it would cost to shift demand to a cheaper tariff window.

    Why Energy Management Software Matters in the Middle East

    Commercial and industrial facilities in the GCC face an energy management challenge unlike most other regions. Cooling alone accounts for up to 70% of electricity consumption in GCC commercial buildings during summer months; a baseline load that leaves relatively little margin for inefficiency elsewhere. At the same time, regional governments are implementing increasingly stringent energy efficiency mandates:

    The UAE’s Demand Side Management program targets a 40% reduction in energy consumption by 2050. Saudi Arabia’s Vision 2030 energy efficiency components require industrial operators to monitor and report consumption data. Oman’s sustainability roadmap imposes measurable energy performance obligations on public and private sector facilities. For organizations operating across the GCC, energy management software is no longer optional infrastructure, but it is the compliance and cost-control mechanism that makes these obligations achievable.

    How Energy Management Software Works

    A complete energy monitoring platform operates across three layers:

    Layer 1 — Sensors and Meters

    Smart meters, current transformers, and voltage sensors are installed at the key measurement points in your electrical infrastructure, main distribution boards, sub-panels, individual circuit breakers, and equipment-level connections for high-consumption assets such as HVAC units, chillers, lighting systems, and production machinery.

    These devices capture real-time consumption data, kilowatts drawn, voltage levels, power factor, and current at configurable intervals and transmit it to the gateway layer.

    Layer 2 — IoT Gateway

    The IoT gateway aggregates readings from all connected meters and sensors and transmits them to the EMS software platform over your facility’s IP network. Elidiso’s Modbus Gateway supports this function natively which collects energy data from Modbus RTU-compatible meters and sensors via RS-485 wiring and forwarding it to the monitoring platform over Ethernet.

    The gateway ensures continuous data transmission even during network disruptions, with SMS backup alerting for critical threshold events.

    Layer 3 — Energy Management Software Platform

    All consumption data arrives at the EMS software platform; a web-based dashboard that gives your team complete visibility over energy use across the facility. This is where raw meter data becomes actionable intelligence.

    What Energy Management Software Monitors

    A well-configured energy management system tracks every significant consumer of electricity in your facility:

    • HVAC and cooling systems: the largest single energy consumer in GCC facilities, where even small efficiency improvements translate into significant cost savings
    • Lighting: monitored by zone and time period to identify areas where occupancy-based controls could reduce consumption
    • IT and server infrastructure: power usage effectiveness (PUE) monitoring for data center and server room environments
    • Industrial equipment and production machinery: load profiling per machine to identify energy-intensive processes and optimize scheduling
    • Building services: elevators, pumps, water heating, and other auxiliary systems that collectively represent significant consumption
    • Sub-metering by tenant or floor: in multi-tenant commercial buildings, individual consumption tracking for billing and benchmarking purposes

    The ability to monitor at this level of granularity is what separates a true EMS software platform from a basic utility meter and what makes it possible to identify the specific systems and behaviors driving energy cost.

    Key Features of Energy Management Software

    Real-Time Dashboard

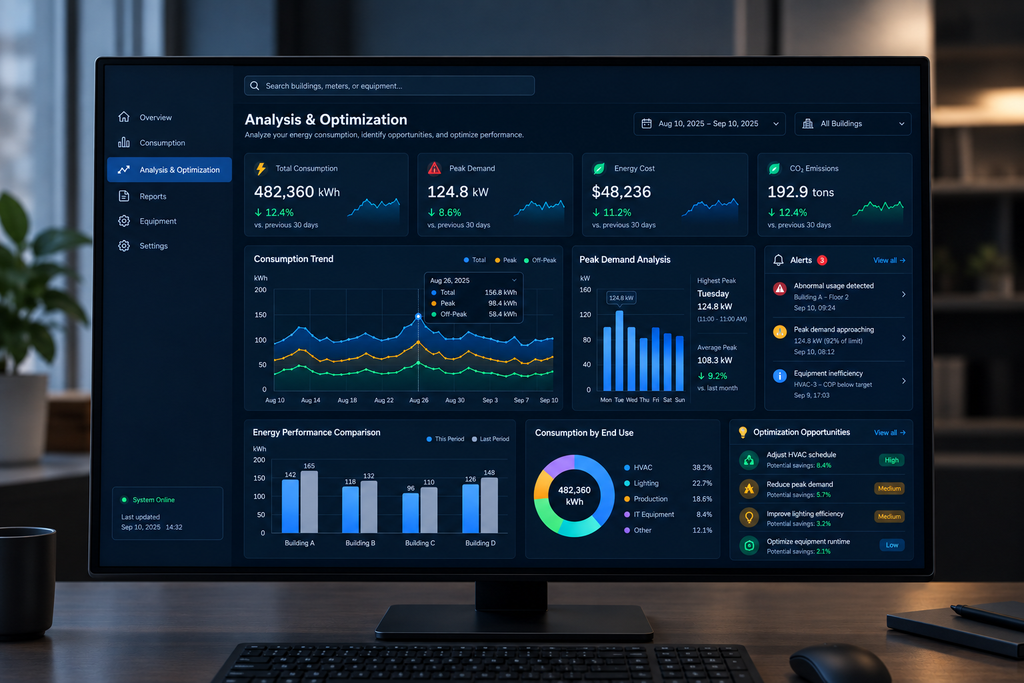
    Live consumption data displayed by system, zone, floor, or building with color-coded indicators that surface abnormal usage patterns immediately. Your team sees what is happening with energy consumption across the facility at this moment, not at the end of the billing cycle.

    Historical Trend Analysis and Benchmarking

    Review energy consumption patterns over days, weeks, months, and years. Compare performance across periods before and after an efficiency initiative, across seasons, or against a baseline year. Identify long-term trends that point to equipment degradation, behavioral changes, or process inefficiencies that are invisible in day-to-day monitoring.

    Peak Demand Analysis

    Peak demand charges, the tariff component based on maximum power draw during a billing period rather than total consumption can represent 30–40% of an industrial electricity bill. Energy management software identifies the specific events and systems that drive peak demand, giving operations teams the data to shift loads, stagger equipment start-up times, and reduce the peak demand charge without affecting production.

    Abnormal Usage Alerts

    Configurable threshold alerts that notify your team when consumption exceeds defined parameters, a chiller running outside its normal load curve, a production line drawing more current than its baseline, or a building consuming energy at 2am when it should be in standby. These alerts catch equipment faults, operator errors, and unauthorized usage before they appear on the monthly utility bill.

    Compliance and Audit Reporting

    Automated generation of structured energy consumption reports formatted for regulatory submission that supports UAE DSM program reporting, Saudi NCEC energy audit requirements, and Omani sustainability disclosure obligations. No manual data collection. No spreadsheet consolidation.

    What to Look for in Energy Management Software

    When evaluating EMS software platforms for a GCC facility deployment, the key criteria are:

    • Sensor and meter compatibility: does the platform support Modbus RTU and Modbus TCP meter protocols, which are the standard in industrial and commercial electrical infrastructure?
    • Granularity: can it monitor at equipment level, not just building or floor level?
    • Alert configurability: can thresholds be set per system, per time period, and per tariff structure?
    • Integration: does it connect to your BMS, SCADA, or ERP infrastructure via standard protocols?
    • Compliance reporting: does it generate the structured outputs required by GCC regulatory authorities?
    • Scalability: can it expand from a single facility to a multi-site portfolio without a platform change?

    How Elidiso’s Energy Management Software Supports Your Facility

    Elidiso’s EMS software platform is the monitoring and analytics layer that connects your electrical infrastructure data to the operational decisions your team makes every day. Built on the same platform as our environmental monitoring solutions, it aggregates energy consumption data from Modbus-compatible meters and sensors via the Elidiso gateway that gives facility managers, sustainability officers, and operations directors a unified view of both environmental conditions and energy performance in a single dashboard.

    Whether you are managing energy compliance obligations under GCC regulatory frameworks, targeting cost reduction through peak demand management, or building the data foundation for an ISO 50001 energy management certification program, Elidiso’s energy monitoring platform gives you the visibility and the reporting capability your program requires.

    Contact Elidiso today to discuss your facility’s energy management requirements and receive a tailored recommendation.