Blog

  • IoT Solutions in Oman: Industry Overview and Deployment Trends

    IoT Solutions in Oman: Industry Overview and Deployment Trends

    Oman is quietly becoming one of the most active IoT deployment markets in the Middle East. Driven by a combination of ambitious national transformation targets, a maturing industrial base, and growing regulatory pressure on environmental compliance and energy efficiency, organizations across the Sultanate are investing in connected monitoring infrastructure at a pace that would have seemed unlikely five years ago. For technology decision-makers evaluating IoT solutions Oman has become a market where early deployment is no longer a competitive advantage; but it is rapidly becoming an operational and compliance baseline.

    This article examines the key industries driving IoT adoption in Oman, the regulatory and economic forces shaping deployment decisions, and the specific monitoring applications gaining the most traction across the Sultanate’s industrial and commercial sectors.

    Why Oman Is Accelerating IoT Adoption

    IoT deployment in the Middle East

    The context for IoT growth in Oman is inseparable from Oman Vision 2040, the national development framework that sets out a comprehensive economic diversification agenda moving the Sultanate away from hydrocarbon dependence. Two pillars of Vision 2040 are directly accelerating IoT solutions deployment:

    Economic diversification is driving investment in manufacturing, logistics, tourism, and technology sectors, all of which require the kind of operational infrastructure that IoT monitoring provides. New industrial zones at Sohar, Duqm, and Salalah are attracting foreign and domestic investment into facilities that are being built to international operational standards from the ground up, creating natural demand for environmental monitoring, energy management, and network infrastructure systems.

    Sustainability and environmental compliance commitments under Vision 2040 and Oman’s National Energy Strategy require measurable reductions in energy consumption and carbon emissions across industrial and commercial operations. The Ministry of Environment and Climate Affairs (MECA) has progressively tightened environmental reporting requirements for industrial operators and since January 2025, the Muscat Stock Exchange has mandated sustainability reporting for all listed companies against 30 GRI-aligned metrics. For organizations in Oman’s industrial zones, smart facility management through IoT monitoring is now the practical mechanism for meeting these obligations.

    Key Industries Deploying IoT Solutions in Oman

    Oil, Gas, and Energy

    The hydrocarbon sector remains Oman’s largest industrial employer and continues to be the most active early adopter of industrial IoT solutions in the Sultanate. PDO (Petroleum Development Oman), OQ, and their supply chain partners have been deploying connected monitoring infrastructure across upstream and downstream operations for years like tracking environmental conditions, equipment health, and energy consumption at remote sites where manual monitoring is impractical.

    The shift toward renewable energy, Oman has committed to generating 30% of its electricity from renewables by 2030, which is creating new IoT deployment demand for solar farm monitoring, where dust accumulation on panels, ambient temperature, and irradiance data directly affect generation performance and maintenance scheduling.

    Logistics and Cold Chain

    Oman’s strategic location at the intersection of Gulf, Indian Ocean, and African trade routes makes logistics one of the fastest-growing sectors in the Sultanate. The Port of Sohar, Muscat’s logistics parks, and the emerging Duqm port complex are all expanding their cold chain and temperature-sensitive storage infrastructure that creates direct demand for IoT solutions Oman logistics operators can deploy to monitor and document cold chain integrity across their facilities and transport operations.

    Pharmaceutical importers, food distributors, and FMCG companies operating through Oman’s distribution network are facing increasingly specific cold chain compliance requirements under the Ministry of Health’s storage and distribution guidelines; the requirements that continuous IoT temperature monitoring is uniquely positioned to satisfy.

    Manufacturing and Industrial Zones

    Sohar Industrial Port and the Duqm Special Economic Zone are home to a growing cluster of manufacturing operations, petrochemical processing, metal fabrication, food production, and electronics assembly. These facilities share a common operational challenge: the GCC’s extreme heat, dust, and humidity conditions demand environmental monitoring infrastructure that goes beyond what generic commercial building systems can provide.

    Environmental monitoring Middle East deployments in Oman’s industrial zones are typically driven by three parallel requirements, worker safety compliance under the Ministry of Manpower’s occupational health regulations, equipment protection in high-temperature production environments, and the energy consumption data that sustainability reporting obligations require.

    Data Centers and Commercial Real Estate

    Muscat’s commercial real estate market has expanded significantly over the past decade that is driven by government infrastructure investment, tourism development, and the growth of financial and professional services. Data centers supporting Oman’s digital transformation agenda, including government cloud infrastructure and private sector IT facilities represent a high-value IoT deployment environment where the cost of environmental monitoring failure is measured in uptime SLA penalties rather than just operational inconvenience.

    The Regulatory Drivers Shaping IoT Deployment in Oman
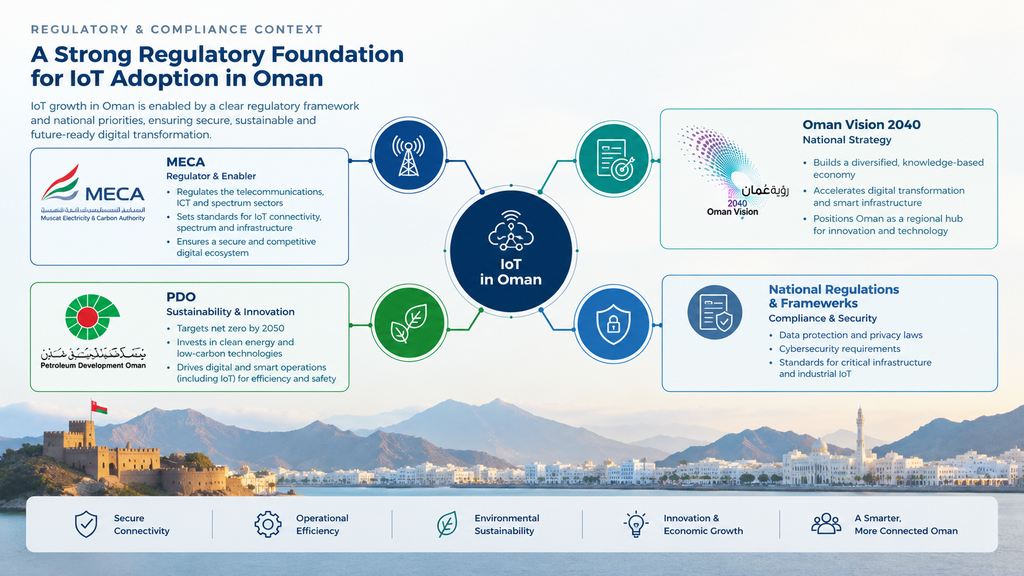
    Three regulatory frameworks are having the most direct impact on IoT monitoring adoption across Omani industries:

    MECA Environmental Compliance requires industrial facilities to monitor and report environmental parameters including air quality, emissions, and waste management. For facilities in designated industrial zones, the reporting frequency and data granularity required by MECA’s permit conditions effectively mandate continuous automated monitoring, manual logs are no longer sufficient.

    Oman’s National Energy Strategy sets sector-specific energy intensity reduction targets for industry, commercial buildings, and government facilities. Organizations subject to these targets need the consumption data that IoT solutions provide to demonstrate progress, identify efficiency opportunities, and generate the reports that regulatory bodies accept.

    MSX Sustainability Reporting, since January 2025, Muscat Stock Exchange-listed companies must disclose against 30 GRI-aligned ESG metrics. Environmental data collection through IoT monitoring systems is the most efficient way to build the data infrastructure these disclosures require, particularly for organizations that previously had no systematic environmental data collection in place.

    What Elidiso Is Seeing in Oman Deployments

    As a company based in Muscat with deployments across Oman’s industrial and commercial sectors, Elidiso observes several consistent patterns in how organizations are approaching IoT solutions Oman deployments in 2026:

    Starting with environmental monitoring, expanding to energy. Most organizations begin their IoT journey with temperature and humidity monitoring, either driven by a specific compliance requirement or a product loss incident and then expand into energy monitoring and network infrastructure visibility as the value of the platform becomes clear to operations teams.

    Wired over wireless for industrial environments. In Oman’s industrial zones, where electrical noise from heavy machinery and extreme heat affect wireless signal reliability, Modbus RTU over RS-485 wired sensor networks consistently outperform wireless alternatives. The reliability and noise immunity of wired industrial IoT solutions in these environments is not a theoretical advantage, but it is a documented operational difference.

    Compliance first, optimization second. The primary driver for most Omani IoT deployments is compliance documentation, proving to MECA, auditors, or insurance providers that environmental conditions were monitored and within acceptable ranges. The operational efficiency benefits, predictive maintenance, energy optimization, process improvement, typically emerge as a secondary value layer once the monitoring infrastructure is in place.

    Multi-site visibility is a priority from day one. Organizations operating across Oman’s geographically dispersed industrial zones: Sohar, Muscat, Duqm, Salalah, and consistently prioritize remote monitoring system capability that aggregates data from all sites into a single dashboard. The distances involved make on-site monitoring impractical, and the operational complexity of managing multiple separate systems is a pain point that a unified platform directly addresses.

    How Elidiso Supports IoT Deployment Across Oman
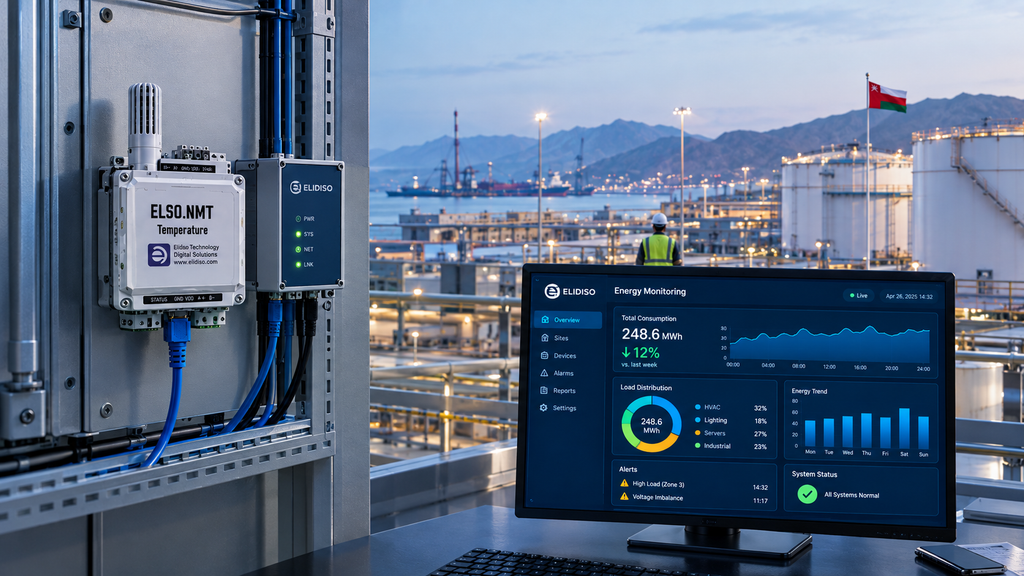
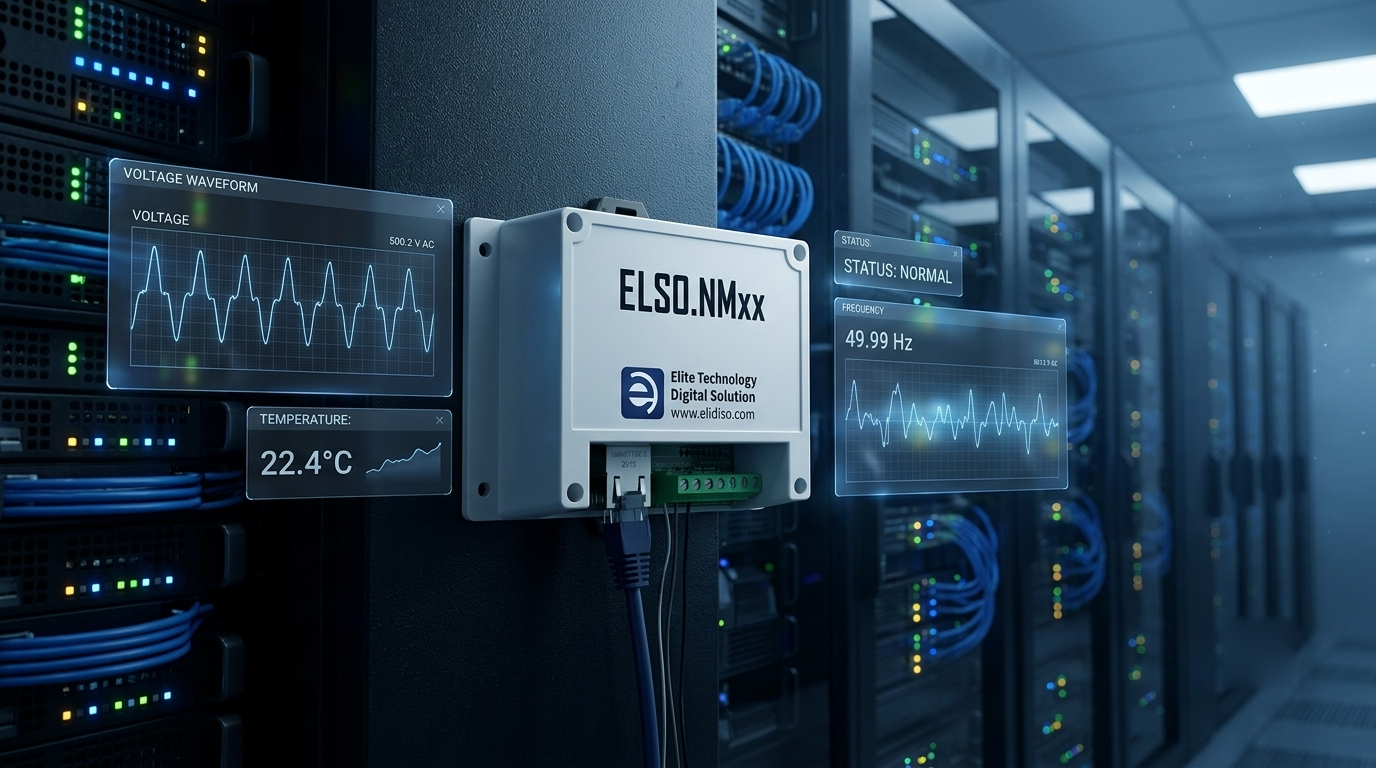
    Elidiso is based in Muscat and has been delivering IoT solutions Oman organizations depend on across environmental monitoring, network monitoring, and energy management since our founding. Our hardware, the ELSO.NMxx Modbus sensor series, ELSO.NSxx standalone sensors, and Elidiso Modbus Gateway is designed and tested for Oman’s specific operating conditions: high ambient temperatures, coastal humidity, and the dust and electrical noise environments of Sohar and Duqm industrial zones.

    Our EMS monitoring software platform gives Omani organizations the real-time dashboards, threshold alerts, compliance reports, and multi-site visibility they need to meet MECA requirements, satisfy MSX sustainability disclosure obligations, and build the operational monitoring infrastructure that Vision 2040’s industrial diversification agenda demands.

    Contact Elidiso today to discuss your facility’s monitoring requirements and find out how our IoT solutions can be deployed across your Oman operations.

  • AI Visual Inspection in Manufacturing

    AI Visual Inspection in Manufacturing

    On a production line running at full speed, a human inspector has a fraction of a second to assess each unit passing in front of them. The result is an inspection process that is inconsistent at best and unreliable at worst, and in high-volume manufacturing, even a 1% defect escape rate translates into thousands of non-conforming units reaching customers, triggering returns, warranty claims, and reputational damage that costs far more than the defects themselves.

    AI visual inspection in manufacturing addresses this problem directly. By replacing or augmenting human visual checks with machine vision systems powered by artificial intelligence, manufacturers achieve inspection speeds, consistency, and accuracy that no human team can match, at every unit, on every shift, without variation.

    What Is AI Visual Inspection?

    AI visual inspection is the use of cameras, lighting systems, and artificial intelligence algorithms to automatically detect defects, anomalies, and non-conformities in manufactured products, in real time, at production line speed, without human intervention at the point of inspection.

    Unlike traditional rule-based machine vision, which relied on fixed thresholds and pre-programmed templates, modern AI visual inspection manufacturing systems use deep learning models trained on thousands of images of conforming and non-conforming parts. These models learn to recognize defects the way an experienced human inspector does: by pattern recognition across a wide range of visual characteristics, not by checking a fixed set of parameters.

    The result is an inspection system that improves over time as it processes more data, adapts to new product variants without complete reprogramming, and catches subtle defects that rule-based systems miss entirely.

    How Machine Vision Catches Defects

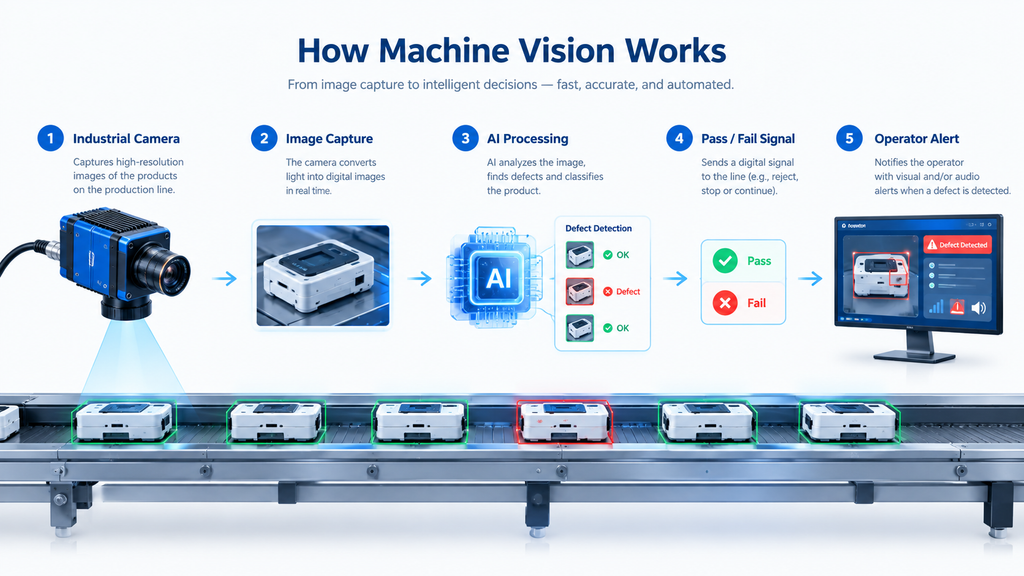
    A complete machine vision system for manufacturing defect detection operates through four stages:

    Stage 1 — Image Acquisition

    Industrial cameras, line scan or area scan, all which depend on the application, capture high-resolution images of every unit as it passes through the inspection station. Controlled lighting is critical at this stage: consistent, calibrated illumination eliminates shadows and reflections that would otherwise create false positives or mask genuine defects. Inspection speeds of hundreds of units per minute are achievable with the right camera and lighting configuration.

    Stage 2 — AI Processing

    Each captured image is passed in real time to the AI quality control algorithm like a deep learning model that has been trained on labeled image datasets showing both conforming parts and specific defect types. The model analyzes the image for deviations from the learned baseline: surface anomalies, dimensional variations, color inconsistencies, missing components, or assembly errors.

    This processing happens in milliseconds, which is fast enough to keep pace with production line speeds and deliver a decision before the unit reaches the next station.

    Stage 3 — Pass / Fail Decision

    The AI model outputs a confidence score for each conforming unit, or non-conforming, with the specific defect type and location identified and marked on the image. Units that fall below the conformance threshold are flagged for rejection or diversion to a secondary inspection station. The decision is logged with a timestamp, image capture, and defect classification for full traceability.

    Stage 4 — Alert and Reporting

    When defect rates exceed defined thresholds that signals a process drift, material batch issue, or equipment problem, and the automated defect detection system triggers an alert to the production supervisor. Rather than discovering a quality problem at the end of a shift through sampling, the team is notified in real time and can intervene before the issue propagates through the production run.

    What AI Visual Inspection Detects

    Computer vision quality control systems can be trained to detect a wide range of defect types across different manufacturing environments:

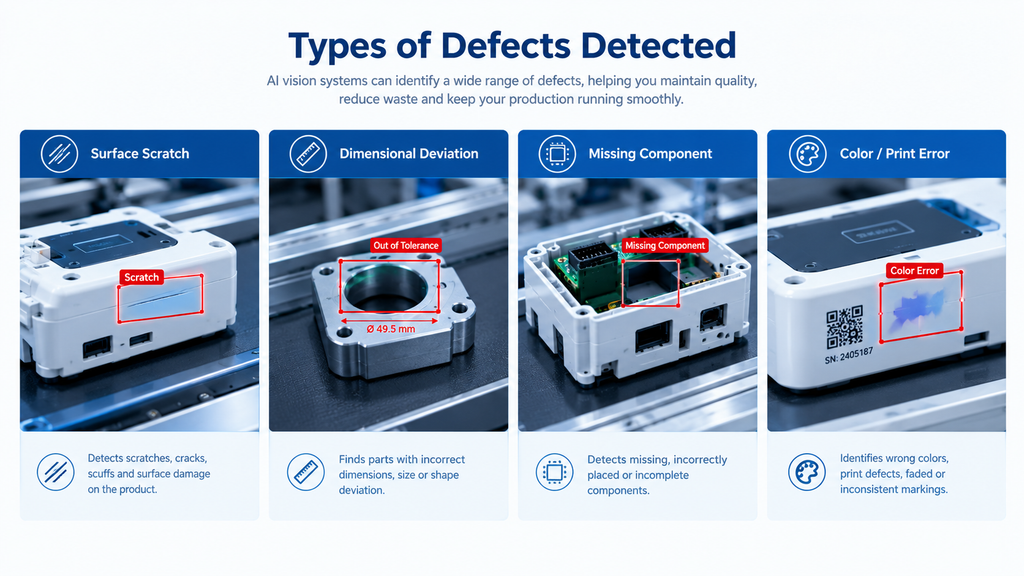
    • Surface defects: scratches, dents, cracks, pitting, corrosion, and surface contamination on metal, plastic, glass, and ceramic components
    • Dimensional deviations: parts that fall outside specified tolerances for length, width, diameter, or height, detected through precise pixel-level measurement
    • Missing components: absent fasteners, labels, connectors, or sub-assemblies that should be present at a given production stage
    • Color and print defects: incorrect color, faded or misaligned printing, barcode readability failures, and label placement errors
    • Assembly errors: incorrect component orientation, reversed polarity, mis-seated connectors, and incomplete sub-assembly
    • Weld and solder quality: void detection, cold joints, bridging, and insufficient coverage in welding and soldering applications

    The specific defect types a system is trained to detect depend on the product and process, a machine vision system for PCB inspection has a very different training dataset from one deployed for automotive body panel inspection. This is why training data quality and domain expertise in the inspection application are as important as the AI algorithm itself.

    Where AI Visual Inspection Is Used in Manufacturing

    AI visual inspection manufacturing applications span a wide range of industries and production environments:

    • Electronics and PCB manufacturing: solder joint inspection, component placement verification, and conformal coating coverage
    • Automotive: body panel surface inspection, weld quality, interior assembly verification, and paint defect detection
    • Food and beverage packaging: fill level, seal integrity, label placement, and date code legibility
    • Pharmaceutical: tablet and capsule integrity, blister pack completeness, and label accuracy under strict regulatory traceability requirements
    • Metal fabrication: surface finish inspection, dimensional conformance, and weld quality on structural components
    • Consumer electronics: housing surface quality, display panel inspection, and connector alignment

    AI Visual Inspection vs. Traditional Quality Control

    The advantages of AI visual inspection over traditional human and rule-based inspection methods are significant, particularly at scale:

    Human InspectionRule-Based VisionAI Visual Inspection
    SpeedLimited by human reaction timeFast but inflexibleFast and adaptive
    ConsistencyDegrades with fatigueConsistent within fixed rulesConsistent across all conditions
    Defect rangeBroad but variableNarrow, pre-programmed onlyBroad and expanding with training
    New product variantsRetrainable but slowRequires full reprogrammingAdaptable with incremental retraining
    TraceabilityManual logsAutomatedFully automated with image archive

    For high-volume production environments where quality consistency and traceability are non-negotiable, automated defect detection through AI visual inspection is not simply a productivity tool; but it is a quality management infrastructure investment.

    The Role of Industrial IoT in AI Visual Inspection

    AI visual inspection systems do not operate in isolation. In a connected manufacturing environment, they form part of a broader industrial IoT solutions architecture which shares data with production management systems, quality management platforms, and environmental monitoring infrastructure.

    When an AI inspection system detects a spike in defect rates, that signal can be correlated with environmental monitoring data, temperature variations in the production area, humidity changes that affect material properties, or vibration anomalies from equipment, to identify the root cause rather than simply flagging the symptom. This integration of computer vision quality control with environmental and operational IoT data is what transforms inspection from a reactive process into a predictive one.

    Contact our team today to discuss your inspection requirements and receive a tailored solution recommendation.

  • Energy Management Software: What It Is and How It Works

    Energy Management Software: What It Is and How It Works

    Energy is one of the largest controllable costs in any commercial or industrial facility; yet for most organizations, it remains one of the least visible. Electricity is consumed continuously across dozens of systems and hundreds of devices, but without the right tools, the data generated by that consumption never reaches the people who could act on it. Energy management software changes that turns raw consumption data into actionable intelligence that facility managers, operations directors, and sustainability teams can use to reduce costs, improve efficiency, and meet the growing compliance demands of regulators across the Middle East and beyond.

    This guide explains what energy management software is, how it works, what it monitors, and what to look for when selecting a platform for your facility.

    What Is Energy Management Software?

    Energy management software (EMS) is a platform that collects, processes, and presents energy consumption data from across a facility or portfolio of buildings which gives operations teams real-time and historical visibility over how energy is being used, where it is being wasted, and what can be done to reduce consumption without compromising operations.
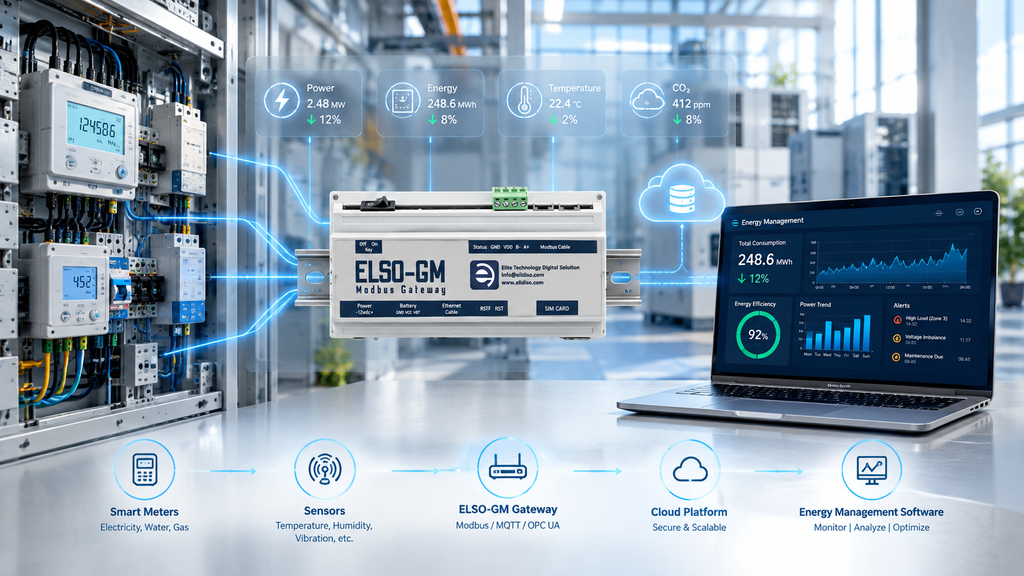
    At its core, an energy management system connects to the electrical infrastructure of a facility through smart meters, current sensors, voltage monitors, and IoT gateways, and aggregates the resulting data into a centralized dashboard. From that dashboard, facility teams can monitor live consumption, review historical trends, set alerts for abnormal usage, and generate the compliance reports that regulators and auditors require.

    The distinction between basic metering and a true EMS software platform lies in what happens to the data after it is collected. A smart meter tells you how much energy you used. Energy management software tells you which system used it, when the peak occurred, whether that pattern is normal, and what it would cost to shift demand to a cheaper tariff window.

    Why Energy Management Software Matters in the Middle East

    Commercial and industrial facilities in the GCC face an energy management challenge unlike most other regions. Cooling alone accounts for up to 70% of electricity consumption in GCC commercial buildings during summer months; a baseline load that leaves relatively little margin for inefficiency elsewhere. At the same time, regional governments are implementing increasingly stringent energy efficiency mandates:

    The UAE’s Demand Side Management program targets a 40% reduction in energy consumption by 2050. Saudi Arabia’s Vision 2030 energy efficiency components require industrial operators to monitor and report consumption data. Oman’s sustainability roadmap imposes measurable energy performance obligations on public and private sector facilities. For organizations operating across the GCC, energy management software is no longer optional infrastructure, but it is the compliance and cost-control mechanism that makes these obligations achievable.

    How Energy Management Software Works

    A complete energy monitoring platform operates across three layers:

    Layer 1 — Sensors and Meters

    Smart meters, current transformers, and voltage sensors are installed at the key measurement points in your electrical infrastructure, main distribution boards, sub-panels, individual circuit breakers, and equipment-level connections for high-consumption assets such as HVAC units, chillers, lighting systems, and production machinery.

    These devices capture real-time consumption data, kilowatts drawn, voltage levels, power factor, and current at configurable intervals and transmit it to the gateway layer.

    Layer 2 — IoT Gateway

    The IoT gateway aggregates readings from all connected meters and sensors and transmits them to the EMS software platform over your facility’s IP network. Elidiso’s Modbus Gateway supports this function natively which collects energy data from Modbus RTU-compatible meters and sensors via RS-485 wiring and forwarding it to the monitoring platform over Ethernet.

    The gateway ensures continuous data transmission even during network disruptions, with SMS backup alerting for critical threshold events.

    Layer 3 — Energy Management Software Platform

    All consumption data arrives at the EMS software platform; a web-based dashboard that gives your team complete visibility over energy use across the facility. This is where raw meter data becomes actionable intelligence.

    What Energy Management Software Monitors

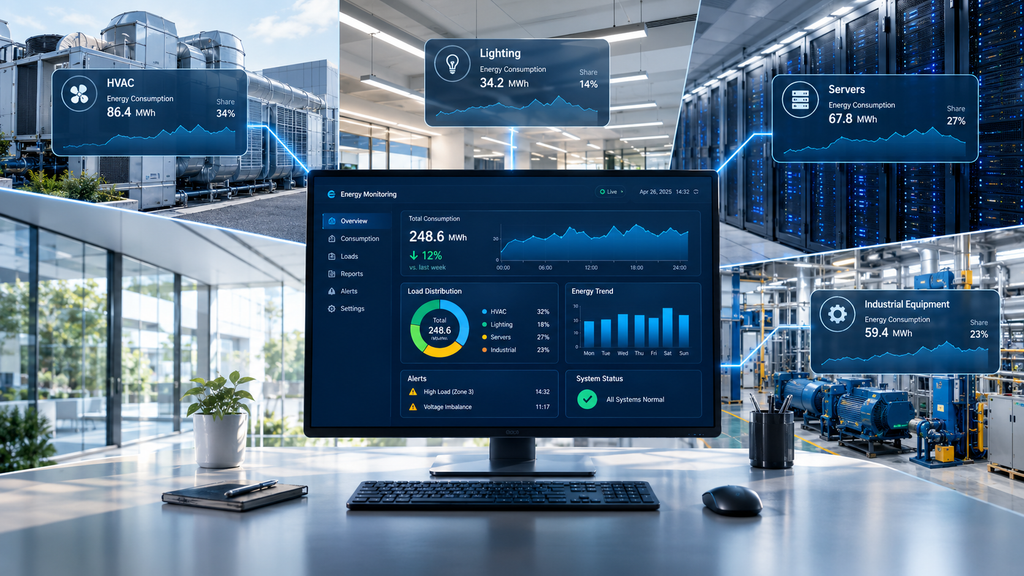
    A well-configured energy management system tracks every significant consumer of electricity in your facility:

    • HVAC and cooling systems: the largest single energy consumer in GCC facilities, where even small efficiency improvements translate into significant cost savings
    • Lighting: monitored by zone and time period to identify areas where occupancy-based controls could reduce consumption
    • IT and server infrastructure: power usage effectiveness (PUE) monitoring for data center and server room environments
    • Industrial equipment and production machinery: load profiling per machine to identify energy-intensive processes and optimize scheduling
    • Building services: elevators, pumps, water heating, and other auxiliary systems that collectively represent significant consumption
    • Sub-metering by tenant or floor: in multi-tenant commercial buildings, individual consumption tracking for billing and benchmarking purposes

    The ability to monitor at this level of granularity is what separates a true EMS software platform from a basic utility meter and what makes it possible to identify the specific systems and behaviors driving energy cost.

    Key Features of Energy Management Software

    Real-Time Dashboard

    Live consumption data displayed by system, zone, floor, or building with color-coded indicators that surface abnormal usage patterns immediately. Your team sees what is happening with energy consumption across the facility at this moment, not at the end of the billing cycle.

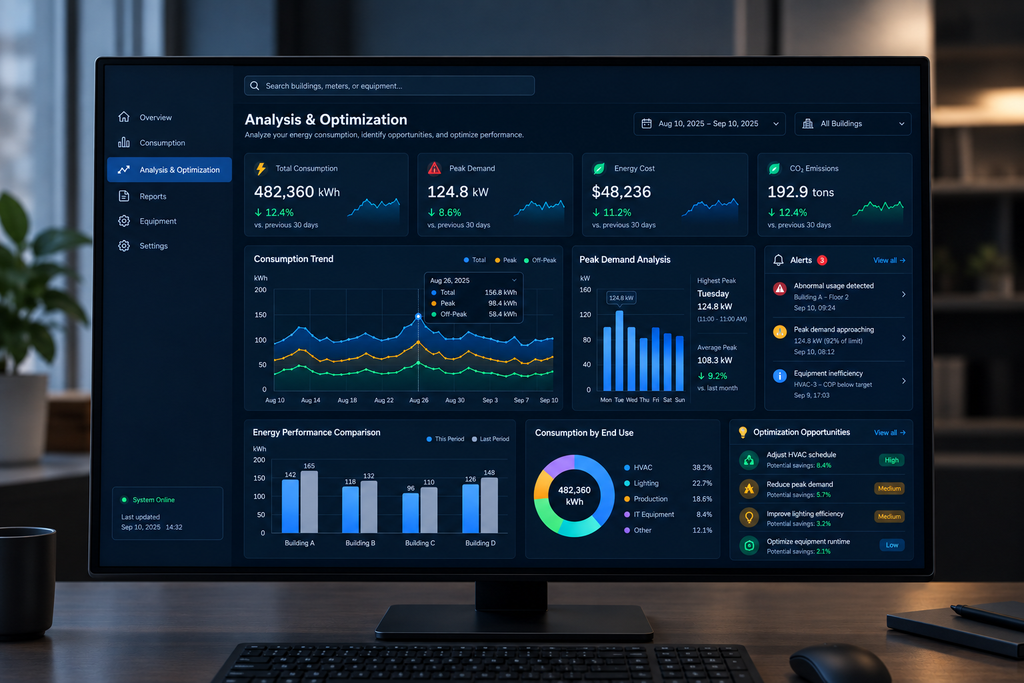
    Historical Trend Analysis and Benchmarking

    Review energy consumption patterns over days, weeks, months, and years. Compare performance across periods before and after an efficiency initiative, across seasons, or against a baseline year. Identify long-term trends that point to equipment degradation, behavioral changes, or process inefficiencies that are invisible in day-to-day monitoring.

    Peak Demand Analysis

    Peak demand charges, the tariff component based on maximum power draw during a billing period rather than total consumption can represent 30–40% of an industrial electricity bill. Energy management software identifies the specific events and systems that drive peak demand, giving operations teams the data to shift loads, stagger equipment start-up times, and reduce the peak demand charge without affecting production.

    Abnormal Usage Alerts

    Configurable threshold alerts that notify your team when consumption exceeds defined parameters, a chiller running outside its normal load curve, a production line drawing more current than its baseline, or a building consuming energy at 2am when it should be in standby. These alerts catch equipment faults, operator errors, and unauthorized usage before they appear on the monthly utility bill.

    Compliance and Audit Reporting

    Automated generation of structured energy consumption reports formatted for regulatory submission that supports UAE DSM program reporting, Saudi NCEC energy audit requirements, and Omani sustainability disclosure obligations. No manual data collection. No spreadsheet consolidation.

    What to Look for in Energy Management Software

    When evaluating EMS software platforms for a GCC facility deployment, the key criteria are:

    • Sensor and meter compatibility: does the platform support Modbus RTU and Modbus TCP meter protocols, which are the standard in industrial and commercial electrical infrastructure?
    • Granularity: can it monitor at equipment level, not just building or floor level?
    • Alert configurability: can thresholds be set per system, per time period, and per tariff structure?
    • Integration: does it connect to your BMS, SCADA, or ERP infrastructure via standard protocols?
    • Compliance reporting: does it generate the structured outputs required by GCC regulatory authorities?
    • Scalability: can it expand from a single facility to a multi-site portfolio without a platform change?

    How Elidiso’s Energy Management Software Supports Your Facility

    Elidiso’s EMS software platform is the monitoring and analytics layer that connects your electrical infrastructure data to the operational decisions your team makes every day. Built on the same platform as our environmental monitoring solutions, it aggregates energy consumption data from Modbus-compatible meters and sensors via the Elidiso gateway that gives facility managers, sustainability officers, and operations directors a unified view of both environmental conditions and energy performance in a single dashboard.

    Whether you are managing energy compliance obligations under GCC regulatory frameworks, targeting cost reduction through peak demand management, or building the data foundation for an ISO 50001 energy management certification program, Elidiso’s energy monitoring platform gives you the visibility and the reporting capability your program requires.

    Contact Elidiso today to discuss your facility’s energy management requirements and receive a tailored recommendation.

  • What Is a Modbus Gateway and How Does It Connect Your Sensors to Your Software?

    What Is a Modbus Gateway and How Does It Connect Your Sensors to Your Software?

    If you have deployed, or are evaluating, a Modbus-based environmental monitoring system, you will have encountered the term Modbus gateway at some point in the architecture conversation. It sits between your sensors and your monitoring software, and without it, the data your sensors collect never reaches the platform where your team can act on it. Yet for many facility managers and operations teams, exactly what a Modbus gateway does, and why it is essential how it remains unclear.

    This guide explains what a Modbus gateway is, how it works within an industrial monitoring system, the different types available, and what to look for when selecting one for your facility.

    What Is a Modbus Gateway?

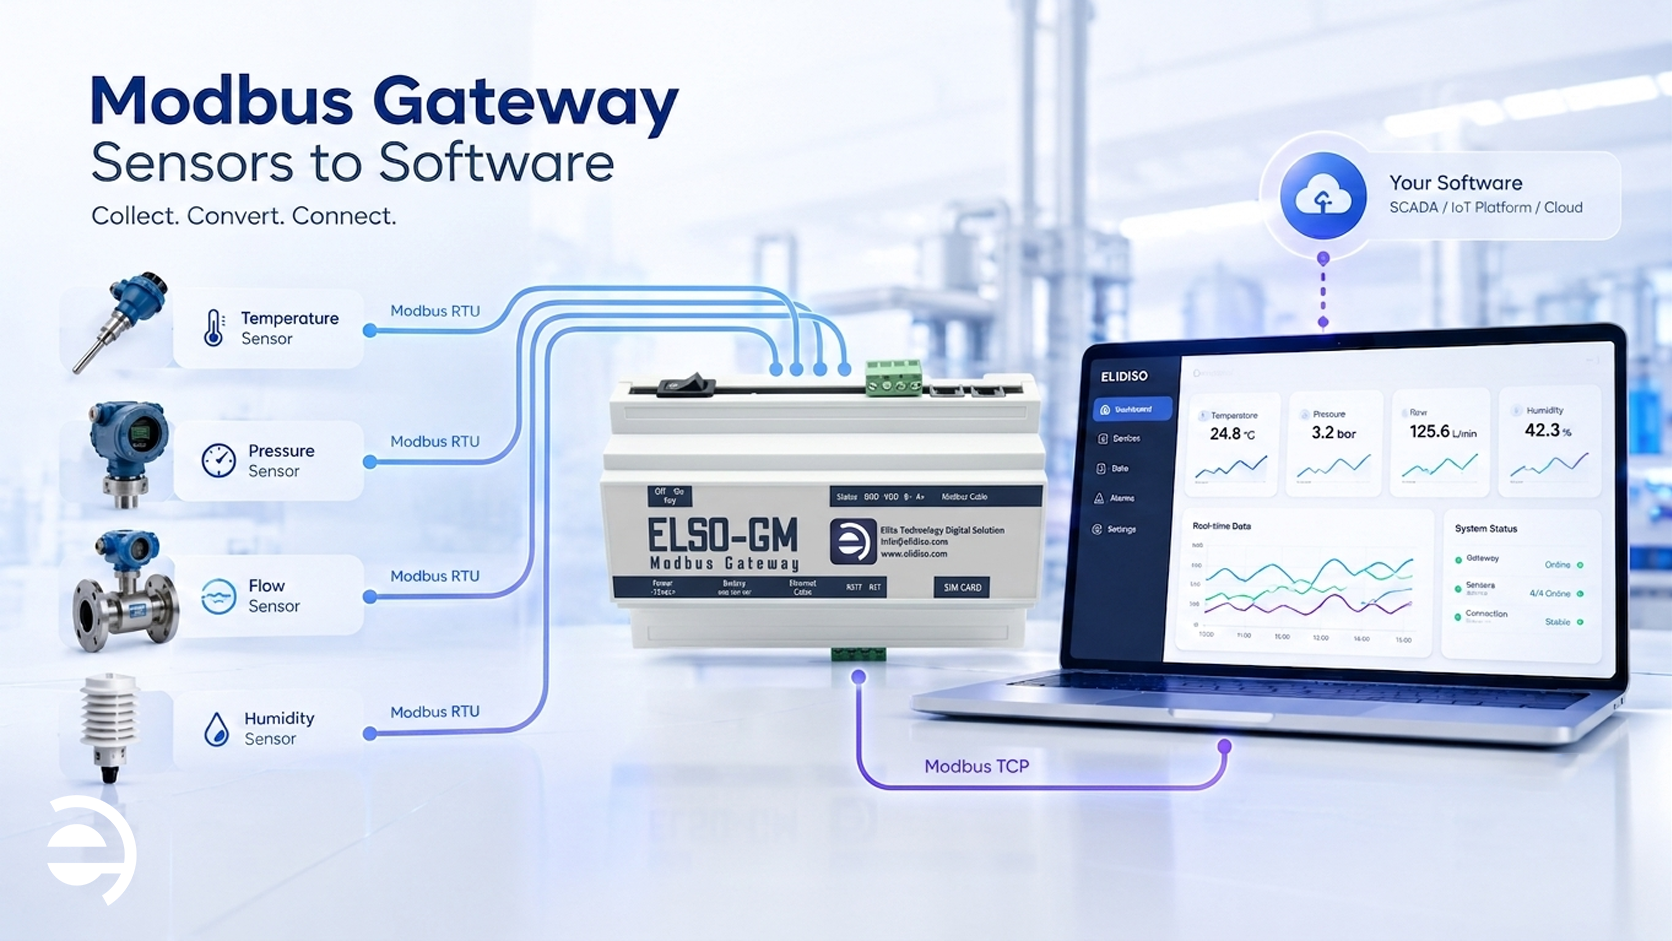
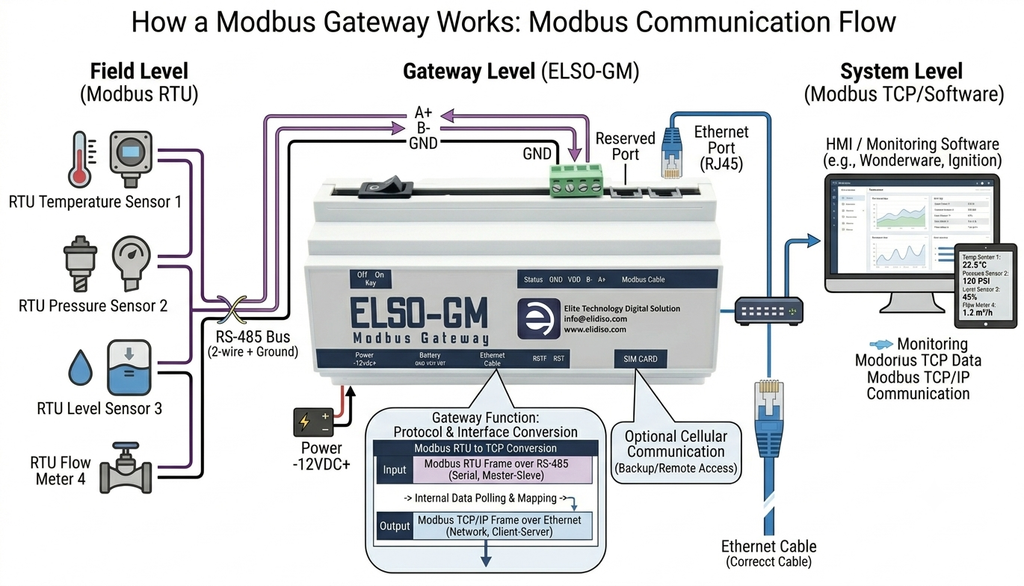
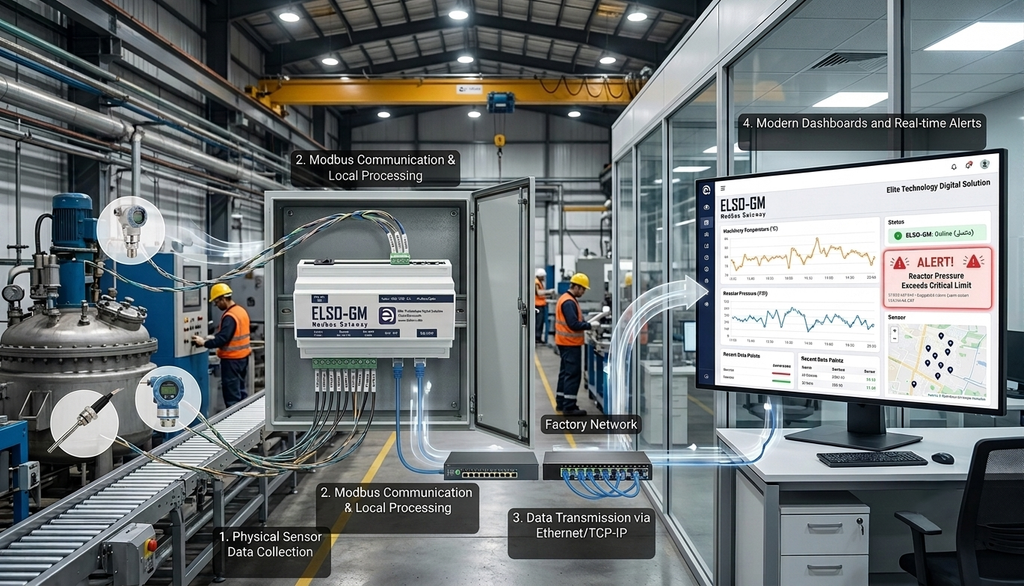
    A Modbus gateway is a hardware device that acts as a protocol bridge, converting data from one communication format to another so that devices using different protocols can exchange information. In the context of industrial IoT and environmental monitoring, a Modbus gateway typically performs one core function: it converts data from Modbus RTU, the serial communication protocol used by wired sensors, into Modbus TCP or another IP-based format that can be transmitted over an Ethernet or Wi-Fi network to a monitoring platform.

    In plain terms: your sensors speak one language (Modbus RTU over RS-485 wiring), your monitoring software speaks another (IP-based network communication), and the Modbus gateway translates between them, seamlessly and in real time.

    Why Is a Modbus Gateway Necessary?

    To understand why a Modbus gateway is necessary, it helps to understand the architecture of a Modbus sensor network. Modbus RTU sensors are wired in a daisy-chain topology along an RS-485 bus, a two-wire serial communication line that can extend up to 1,200 meters and connect up to 247 devices. This is an excellent architecture for industrial environments: robust, noise-resistant, and proven over decades of deployment.

    The limitation is that RS-485 and Modbus RTU are serial protocols, they cannot natively communicate over an IP network. Your monitoring software, on the other hand, operates in the IP world, so it receives data over Ethernet, processes it through a web interface, and delivers alerts via email or SMS. Without a Modbus gateway to bridge these two worlds, the sensor data has nowhere to go.

    The gateway solves this by sitting on the RS-485 bus, continuously polling each sensor in sequence, collecting the latest readings, and forwarding them, translated into Modbus TCP or another IP protocol, to the monitoring platform over your facility’s network infrastructure.

    Modbus RTU vs Modbus TCP — What’s the Difference?

    Before going further, it is worth clarifying the distinction between the two Modbus variants a gateway typically handles:

    Modbus RTU

    Modbus RTU is the original serial implementation of the Modbus protocol. It communicates over RS-485 (or RS-232) wiring, transmits data in a compact binary format, and is polled by a master device, in this case, the gateway, which requests data from each sensor in turn. Modbus RTU is the protocol used by the vast majority of industrial sensors, including the Elidiso ELSO.NMxx sensor series.

    Key characteristics: wired serial communication, compact data format, highly noise-resistant, cable runs up to 1,200 meters, up to 247 devices per bus.

    Modbus TCP

    Modbus TCP is Modbus adapted for TCP/IP networks, essentially the same data structure as Modbus RTU, but transmitted over standard Ethernet infrastructure rather than serial wiring. It removes the distance limitations of RS-485 and allows multiple masters to communicate with devices simultaneously, making it well-suited to network-connected monitoring platforms and SCADA systems.

    A Modbus TCP gateway, also called an RS485 to Ethernet gateway, performs the conversion between these two variants, making your RS-485 sensor network accessible to any IP-based monitoring system. This is the most common type of Modbus gateway deployed in environmental monitoring applications.

    How a Modbus Gateway Works — Step by Step

    Understanding the operational flow of a Modbus gateway makes it easier to design and troubleshoot a monitoring system. Here is what happens in a typical deployment:

    Step 1 — Sensors Are Polled

    The Modbus gateway continuously polls each sensor on the RS-485 bus in sequence, sending a request to each sensor’s unique Modbus address and collecting the latest reading. Polling intervals are configurable, typically every few seconds to every few minutes depending on the application requirements.

    Step 2 — Data Is Converted

    Each sensor reading, temperature, humidity, CO₂ level, voltage, or any other parameter, is received in Modbus RTU format and converted by the gateway into Modbus TCP or another IP-compatible format. This conversion happens in real time, with no data loss and no manual intervention.

    Step 3 — Data Is Transmitted to the Platform

    The converted data is transmitted over the facility’s IP network, Ethernet or Wi-Fi, to the monitoring software platform. The platform receives the data, logs it with a timestamp, updates the live dashboard, and evaluates whether any readings exceed their defined alert thresholds. If a threshold is breached, the platform triggers an immediate alert to the operations team.

    Step 4 — Backup Alert Delivery

    A well-designed IoT Modbus gateway includes a backup communication channel, typically SMS, that ensures threshold alerts reach your team even if the primary network connection is interrupted. In critical monitoring environments such as data centers and pharmaceutical storage, this backup capability is not optional, it is the safeguard that prevents a network issue from becoming a monitoring blind spot.

    How Many Sensors Can a Modbus Gateway Support?

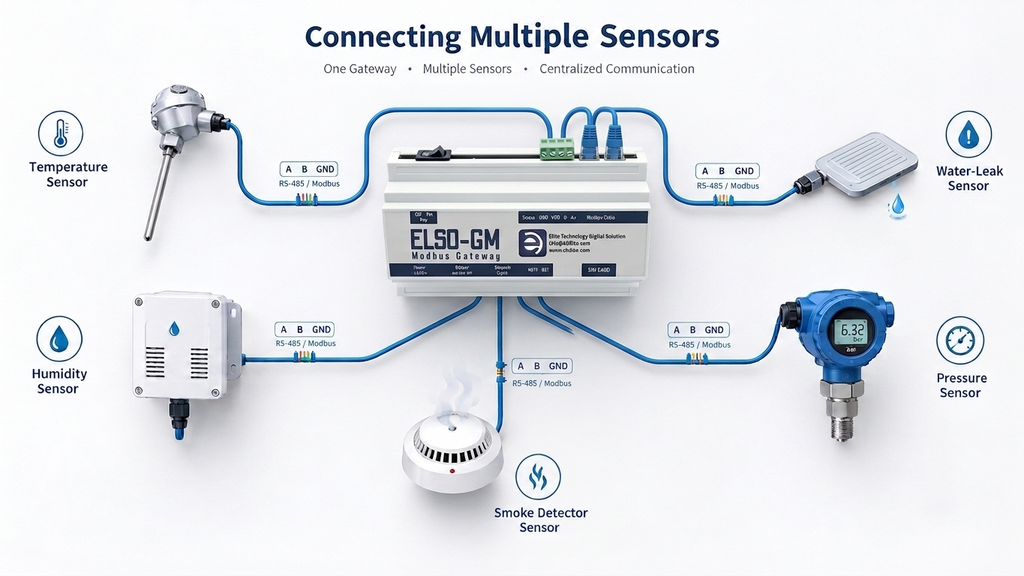
    The number of sensors a single Modbus gateway can support depends on the hardware specification. Entry-level gateways typically support 8–16 devices per bus. Mid-range and industrial-grade gateways, including the Elidiso Modbus Gateway, support up to 30 RTU sensor devices per gateway.

    For larger facilities that require more sensors than a single gateway can accommodate, multiple gateways can be deployed, each covering a zone or floor area, and all feeding data into the same monitoring platform. This scalable architecture means a monitoring system can grow from a single room to an entire multi-building campus without requiring a change of platform or approach.

    What to Look for in an Industrial Modbus Gateway

    Not all Modbus gateway devices are suitable for industrial monitoring environments. When evaluating options for a facility deployment, the key criteria are:

    • Device capacity — How many Modbus RTU sensors can the gateway poll on a single bus? For most facility applications, 16–30 devices per gateway is the practical requirement.
    • Protocol support — Does it support Modbus TCP conversion? Does it also support SNMP for network device monitoring alongside environmental sensors?
    • Backup communication — Does the gateway include an SMS backup channel for alert delivery during network outages? Critical for environments where monitoring continuity is non-negotiable.
    • Industrial rating — Is the gateway rated for the ambient temperature and humidity conditions of your facility environment? A commercial-grade device will not perform reliably in industrial or GCC outdoor conditions.
    • Integration compatibility — Does it integrate with your monitoring software platform and, if needed, your SCADA or BMS infrastructure via standard protocols?
    • Scalability — Can additional gateways be added to expand coverage without changing the monitoring platform or workflow?

    The Modbus Gateway in the Context of Industrial Network Monitoring

    In a complete industrial network monitoring architecture, the Modbus gateway serves a dual role. It is the data aggregation point for the environmental sensor network, collecting temperature, humidity, air quality, and other readings from every connected sensor. And it is itself a monitored device, its connectivity status, polling health, and data transmission continuity should be visible on the same monitoring platform that receives its sensor data.

    When a Modbus gateway goes offline, whether due to a power interruption, network failure, or hardware issue, the monitoring platform loses its data feed from every sensor on that gateway’s bus simultaneously. A platform that monitors gateway health alongside environmental conditions catches this scenario immediately and alerts the operations team, rather than silently losing data until someone notices the dashboard has stopped updating.

    This is why Elidiso’s monitoring platform monitors both environmental sensor data and gateway network status in a single unified dashboard, because industrial network monitoring and environmental monitoring are not separate concerns. They are two layers of the same operational picture.

    How Elidiso’s Modbus Gateway Fits Into Your Monitoring System

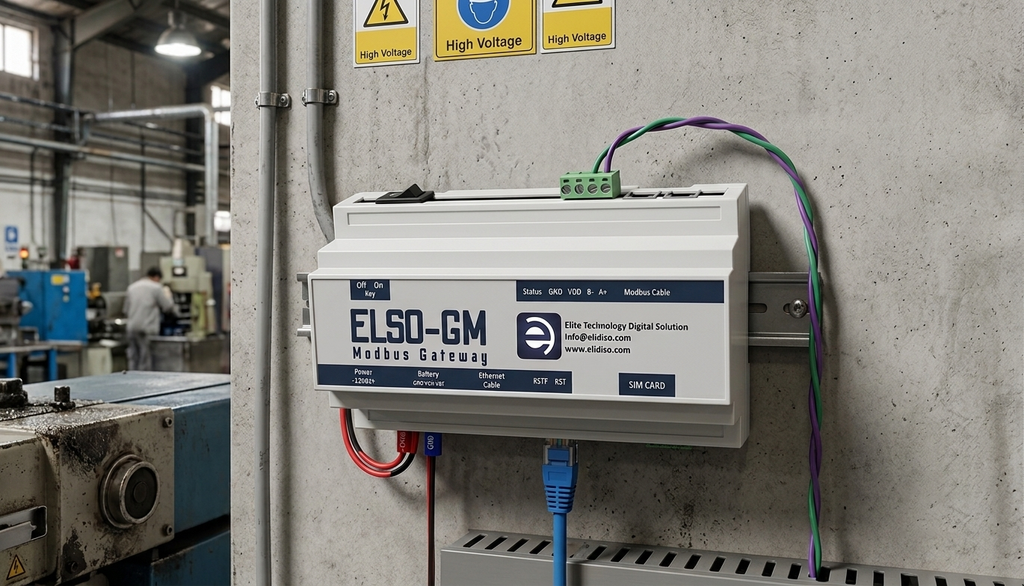
    The Elidiso Modbus gateway supports up to 30 RTU sensor devices per gateway, converts Modbus RTU data to TCP/IP for transmission to the EMS monitoring platform, and includes an SMS backup channel for alert delivery during network interruptions. It integrates directly with the Elidiso ELSO.NMxx sensor series and the EMS monitoring software, forming a complete, end-to-end monitoring architecture from sensor to dashboard.

    For facilities requiring Modbus TCP gateway connectivity to existing SCADA, BMS, or third-party monitoring platforms, the Elidiso gateway supports standard Modbus TCP integration via REST API, allowing it to slot into existing infrastructure without replacing legacy systems.

    Contact Elidiso today to discuss your facility’s sensor network requirements and find out how the Elidiso Modbus gateway can connect your monitoring hardware to your operations platform.

  • ID Card Ribbon Types Explained

    ID Card Ribbon Types Explained

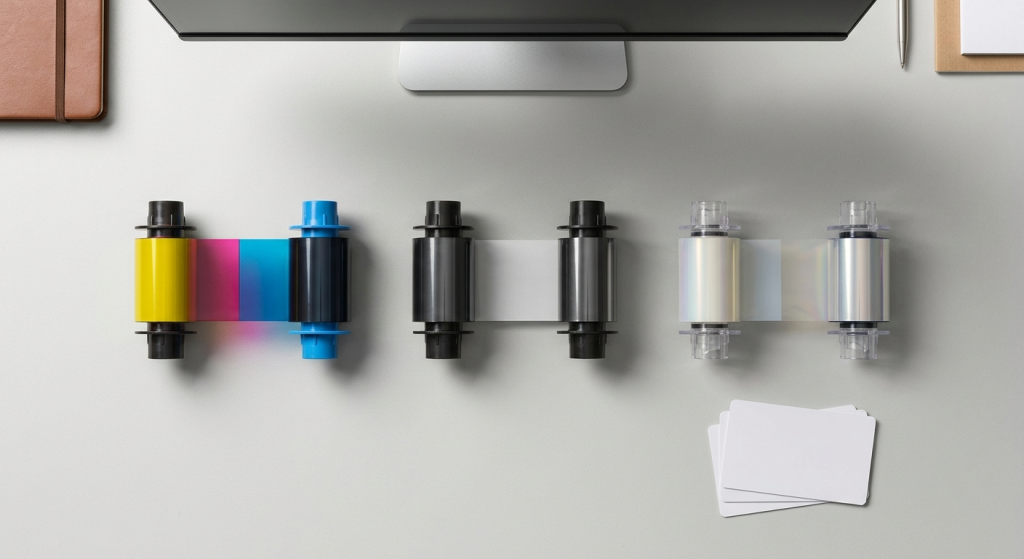
    Walk into any card printing supplies catalog and you will find a confusing array of ribbon codes: YMCK, YMCKO, YMCKOK, KO, UV, monochrome, half-panel, retransfer film…

    For HR managers, procurement teams, and IT administrators who simply need to keep their badge printer running, this alphabet soup creates a genuine challenge. Choose the wrong ID card ribbon type and you risk poor print quality, premature printhead wear, or cards that fail your organization’s security requirements.

    This guide cuts through the confusion. We explain every major ID card ribbon type, what it contains, what it produces, who it is for, and when to use it, so your next ribbon order is the right one.

    How ID Card Ribbons Work

    Before diving into specific ID card ribbon types, it helps to understand the basic mechanics. A card printer ribbon is a long film coated with dye panels in a specific sequence. As the ribbon passes over the card surface, a thermal printhead applies precise heat to each panel, transferring the dye onto the card in the exact pattern needed to reproduce the image, text, or barcode being printed.

    Each ribbon cartridge contains a fixed number of panel sets; one set per card. When the ribbon runs out, it is replaced entirely. The sequence of panels in the cartridge determines what the ribbon can print, which is why different ribbon types produce very different results from the same printer hardware.

    The Main ID Card Ribbon Types — Explained

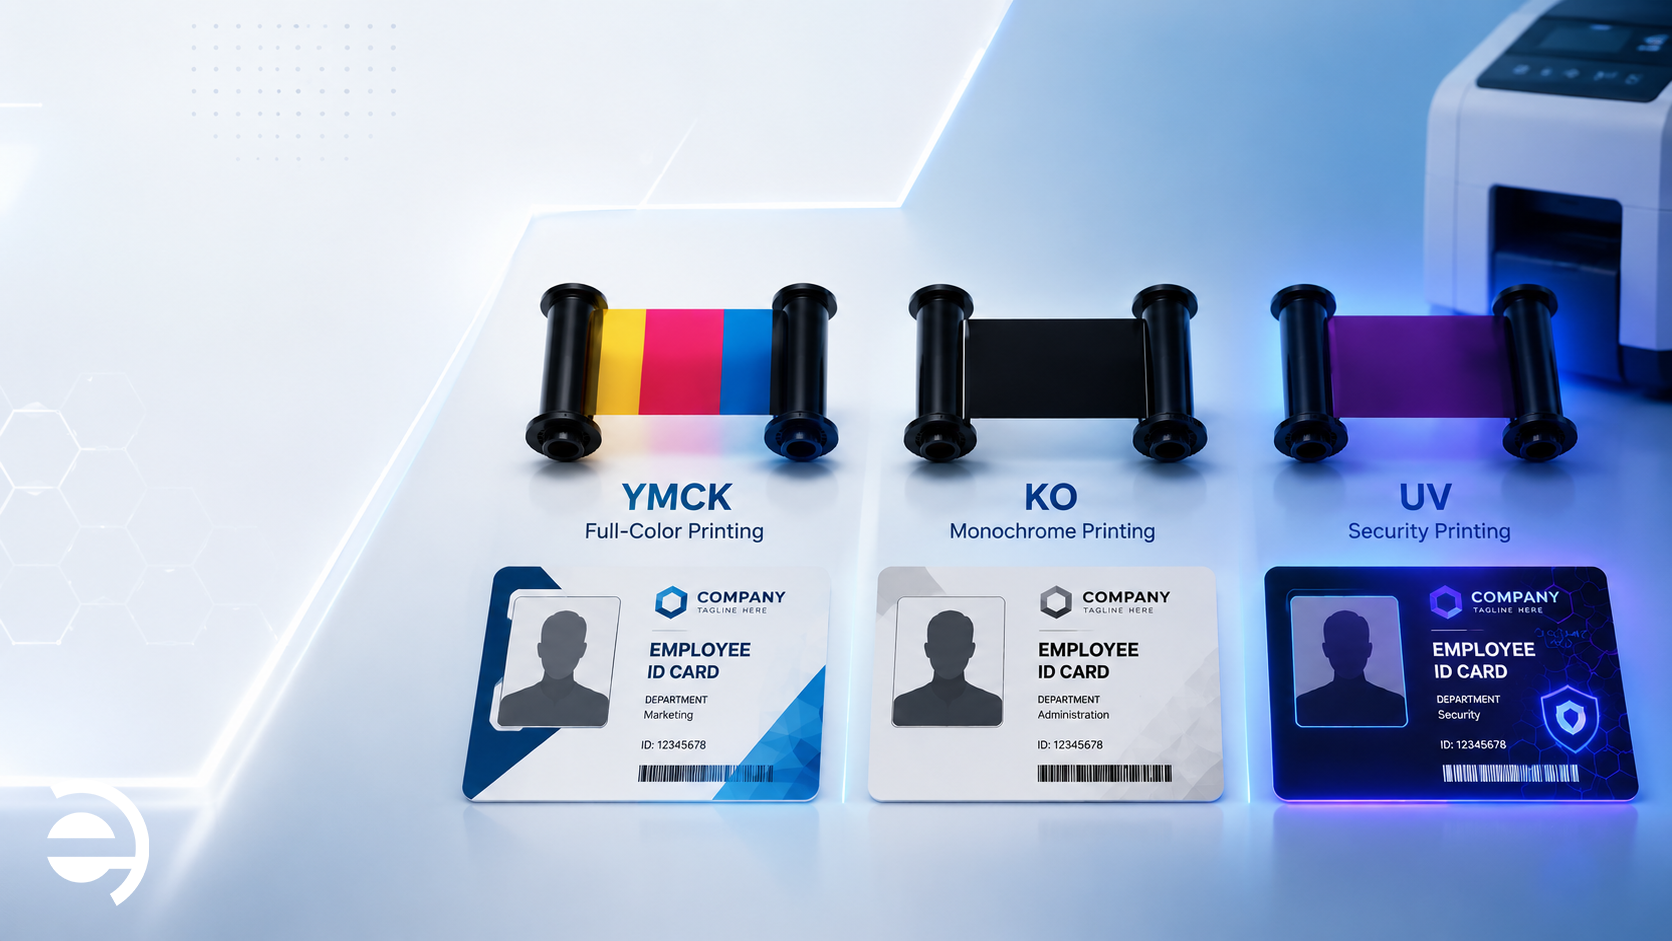
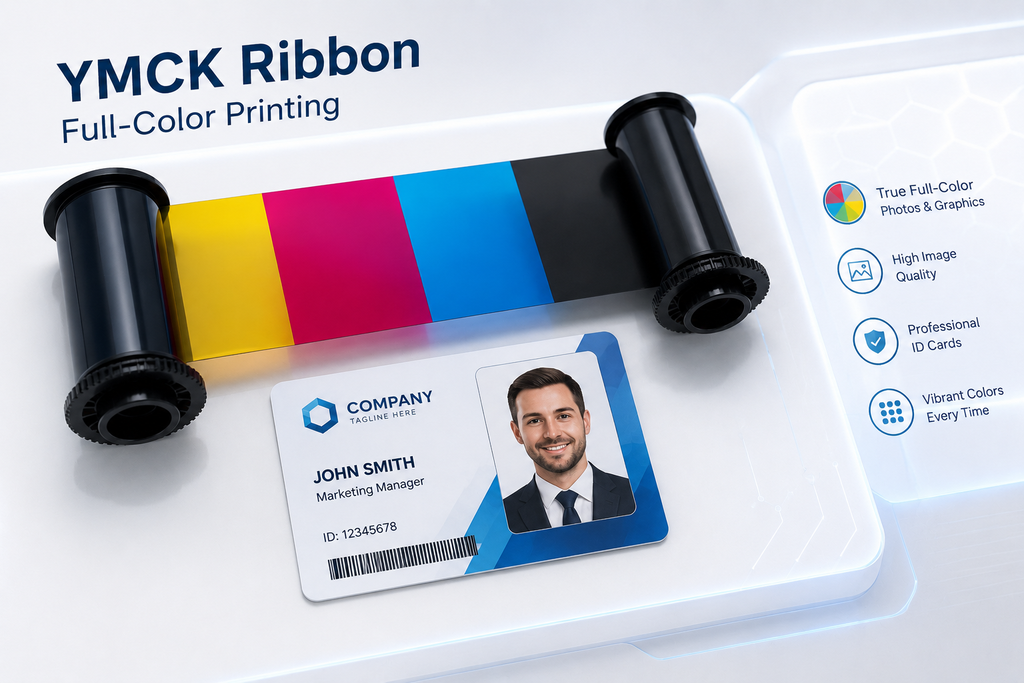
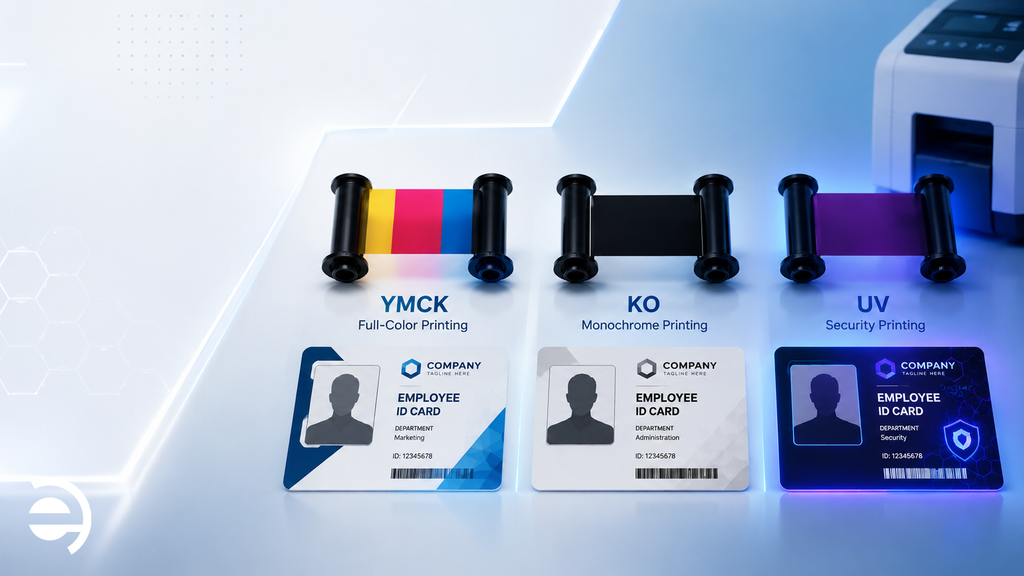
    YMCK — Full Color with Resin Black

    The YMCK ribbon is the standard choice for full-color photo ID badges. Each card cycle uses four dye panels: Yellow (Y), Magenta (M), Cyan (C), and resin Black (K). The three color panels combine through subtractive color mixing to reproduce the full visible spectrum, employee photos, corporate logos, background graphics, and color-coded department indicators. The resin black panel then prints crisp, sharp text, barcodes, and fine detail that the color panels alone cannot render with sufficient precision.

    Best for: Standard corporate employee badges, access control cards, student IDs, visitor credentials. Any application where a professional full-color photo ID is required.

    Key advantage: Balanced cost-per-card, good color accuracy, sharp text and barcode output.

    YMCKO — Full Color with Black and Clear Overlay

    The YMCKO ribbon adds a fifth panel to the YMCK sequence: a clear overlay (O) applied over the entire printed card surface after the color and black layers. This overlay creates a thin protective coating that resists everyday handling wear, minor scratches, moisture, and UV fading, extending card lifespan without requiring a separate overlaminate step.

    The overlay panel in a YMCKO ribbon is thinner than a dedicated overlaminate and offers less protection against sustained wear or deliberate tampering. However, for programs where cards are used daily but not in extreme conditions, YMCKO ribbons provide a practical balance of color quality, moderate durability, and cost efficiency, all in one pass.

    Best for: Mid-volume employee badge programs, loyalty cards, membership credentials, university IDs where moderate durability is sufficient.

    Key advantage: Durability built into the ribbon, no separate lamination hardware or step required.

    YMCKOK — Full Color with Dual Black Panels

    The YMCKOK ribbon contains six panels per card cycle: the standard YMCK color sequence plus a second resin black panel (K). This second black panel enables dual-sided printing in a single pass, the first black panel prints on the front of the card alongside the color layers, while the second black panel prints on the reverse side.

    This ribbon type is the right choice when your card design requires full-color printing on the front and text, barcodes, department information, or a magnetic stripe encoding layer on the back, without running the card through a separate print pass.

    Best for: Dual-sided employee badges with department or access level data on the reverse, transit cards, loyalty cards with variable data on both faces.

    Key advantage: Dual-sided output in a single pass, eliminates the need for two separate print operations.

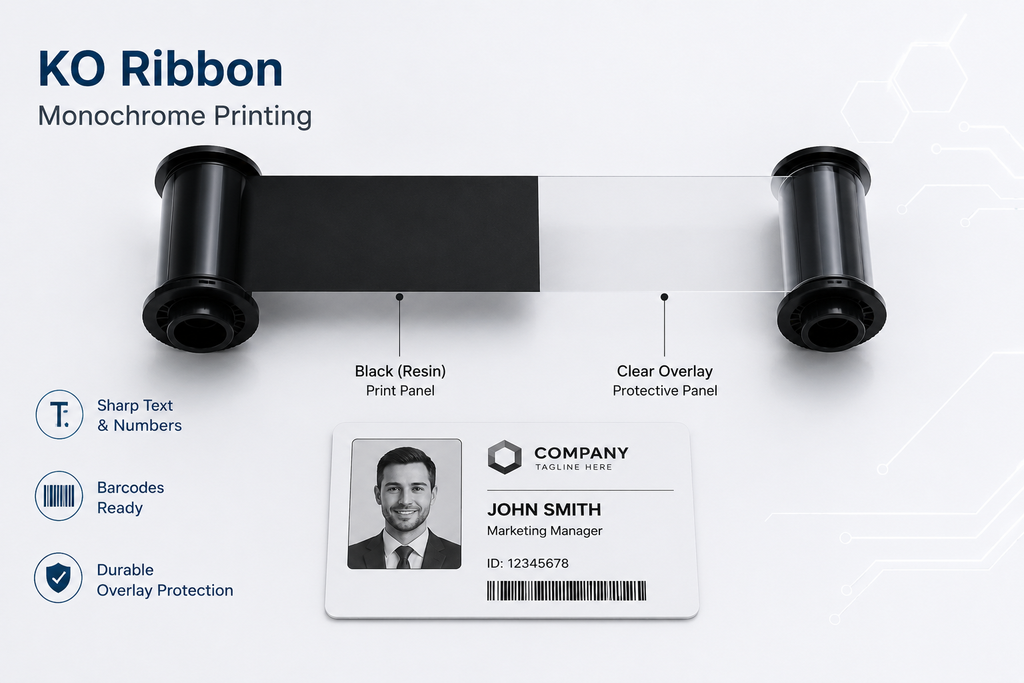
    KO — Monochrome with Clear Overlay

    The KO ribbon prints in a single color, most commonly black, though blue, red, white, gold, and silver variants are available, plus a clear overlay panel. There are no color dye layers. The result is a single-color printed card with a protective overlay finish.

    Monochrome ribbons yield significantly more cards per cartridge than full-color ribbons, typically three to four times as many cards from the same cartridge length. This makes the KO ribbon the most cost-effective ID card ribbon type for high-volume programs where full-color output is not required.

    Best for: Temporary visitor passes, contractor badges, loyalty membership cards, event credentials, and any high-volume program where cost efficiency takes priority over color.

    Key advantage: Lowest cost-per-card of any ribbon type. Ideal for short-lifespan or high-replacement-rate credential programs.

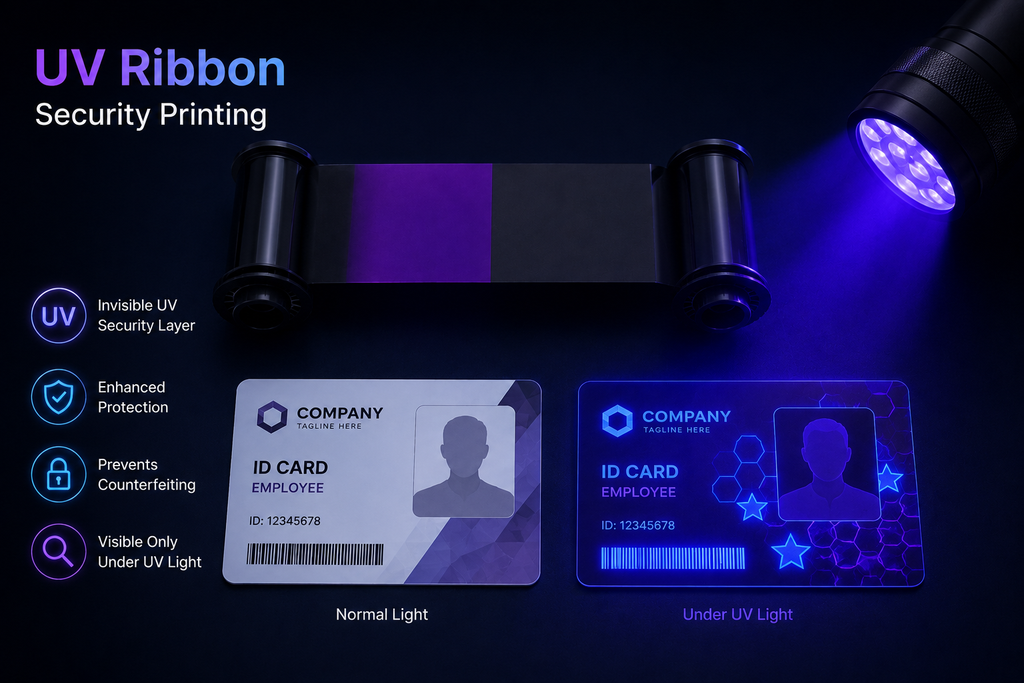
    UV Ribbon — Covert Security Printing

    The UV ribbon is a specialist security ribbon that prints content invisible under normal lighting but clearly visible under ultraviolet (black) light. UV printing adds a covert authentication layer to an ID card, logos, micro-text, patterns, or serial numbers that cannot be seen or easily replicated without specialist equipment and knowledge.

    UV ribbons are never used alone. They are used in combination with a standard YMCK or KO ribbon as part of a multi-layer security printing program. The UV layer is printed first, followed by the visible color or monochrome layer on top, leaving the UV content hidden beneath the surface of the finished card.

    Best for: Government credentials, high-security corporate programs, university IDs, financial services cards, and event credentials where counterfeit prevention is a priority.

    Key advantage: Adds a covert security layer that is difficult to replicate without access to specialist UV printing equipment.

    Retransfer Film — For Retransfer Printers

    Retransfer film is technically not a dye ribbon, it is the printing medium used in retransfer (HDP) card printers. Instead of applying dye directly to the card surface, a retransfer printer first prints the full image onto a clear film, then thermally fuses that film over the entire card surface, producing edge-to-edge, over-the-chip printing that direct-to-card ribbons cannot achieve.

    The result is a higher-resolution, more durable, and more tamper-resistant credential because the printed image is sealed beneath a fused film layer rather than sitting on the card surface. Retransfer film is the correct choice for organizations issuing smart cards with embedded chips or contactless technology, where the surface irregularities of chip placement would cause print defects with direct-to-card ribbons.

    Best for: Smart card and contactless credential programs, high-security government and enterprise IDs, any application requiring edge-to-edge printing.

    Key advantage: Superior print quality, edge-to-edge output, and inherent tamper resistance from the fused film construction.

    How to Choose the Right ID Card Ribbon Type

    With the range of ID card ribbon types clear, the selection decision comes down to four questions:

    1. Do you need full color?

    If your badge design includes a color employee photo, corporate logo, or color-coded elements, start with YMCK or YMCKO. If single-color output is sufficient, visitor passes, contractor badges, basic membership cards; KO monochrome is significantly more cost-effective.

    2. Do you need dual-sided printing?

    If your card has content on both the front and back, department information, barcodes, magnetic stripe data, YMCKOK delivers dual-sided output in a single pass without requiring a second print run.

    3. What security level does your program require?

    Standard employee badge programs are well served by YMCK or YMCKO ribbons. Programs requiring covert authentication, government credentials, financial institution IDs, high-security enterprise badges, should incorporate a UV ribbon as a security layer alongside the visible printing ribbon. Organizations issuing smart cards should specify retransfer film rather than a direct-to-card ribbon.

    4. What is your issuance volume and cost target?

    Higher-volume programs benefit from high-capacity ribbon options that yield more cards per cartridge and reduce replacement frequency. Programs printing fewer than 500 cards per year typically find standard-capacity ribbons sufficient. As a general card printer ribbon guide: the higher your volume, the more important it is to calculate true cost-per-card rather than cost-per-cartridge, a higher upfront cost per cartridge often delivers a lower cost per card at scale.

    One Critical Rule: Match Your Ribbon to Your Printer

    Every card printer model has specific compatibility requirements for ribbons and other consumables. Using an incompatible ribbon can result in printing errors, inconsistent output, and potential equipment damage. Always check the manufacturer’s specifications before selecting an ID card printer ribbon for your equipment.

    If you are unsure which ribbon type or cartridge is compatible with your printer, verify the specifications before ordering. Correct compatibility is essential for maintaining print quality and avoiding unnecessary equipment problems. Regular printer maintenance can also help identify issues that affect printing performance.

    How Elidiso Supports ID Card Printing and Card Printer Maintenance

    Elidiso provides ID card printing services and card printer maintenance for organizations that need professional identification cards and reliable printing operations.
    Our services support a variety of applications, including:

    • Schools and universities: Student ID cards, staff identification, and replacement cards.
    • Gyms and fitness clubs: Membership cards for member identification and registration.
    • Business centers: Employee, tenant, and visitor identification cards.
    • Companies and other organizations: Employee badges and organizational identification cards.

    In addition to card printing, Elidiso provides maintenance for existing card printers to help address equipment issues, maintain print quality, and reduce avoidable interruptions.

    Understanding ribbon compatibility is an important part of managing card printing equipment. Organizations should follow the specifications for their particular printer and use compatible consumables to support reliable operation.

    Whether you need professionally printed identification cards or maintenance for your existing card printer, Elidiso can help with your organization’s card printing requirements.

    Contact Elidiso to discuss your ID card printing needs or inquire about card printer maintenance.

  • Air Quality Monitoring IoT — What CO₂ Sensors Measure and Why It Matters

    Air Quality Monitoring IoT — What CO₂ Sensors Measure and Why It Matters

    Indoor environments can change significantly throughout the day. As people enter a room, ventilation changes, doors open and close, and HVAC systems adjust, the quality of the air can change with them. Air quality monitoring makes it possible to observe these changes continuously rather than relying on occasional manual measurements.

    Among the parameters used in indoor air quality monitoring, carbon dioxide (CO₂) is particularly useful. CO₂ sensors provide a measurable indication of how indoor conditions are changing and can help facility teams understand whether ventilation is keeping up with occupancy.

    But what exactly does a CO₂ sensor measure, and how does it fit into an IoT monitoring system?

    What Is Air Quality Monitoring IoT?

    Air quality monitoring IoT refers to the use of connected sensors and monitoring platforms to continuously collect information about environmental conditions.

    Instead of checking air quality manually at specific times, IoT-based monitoring can collect readings at regular intervals and make the data available through a centralized system.

    Depending on the application, an air quality monitoring system may measure:

    • CO₂ concentration
    • Temperature
    • Relative humidity
    • Particulate matter such as PM2.5
    • Air pressure
    • Volatile organic compounds (VOCs)
    • Other gases or environmental parameters

    The value of IoT is not simply in measuring these parameters. It is in connecting the measurements so that changes can be observed over time, compared across spaces, and used to identify patterns.

    What Does a CO₂ Sensor Measure?

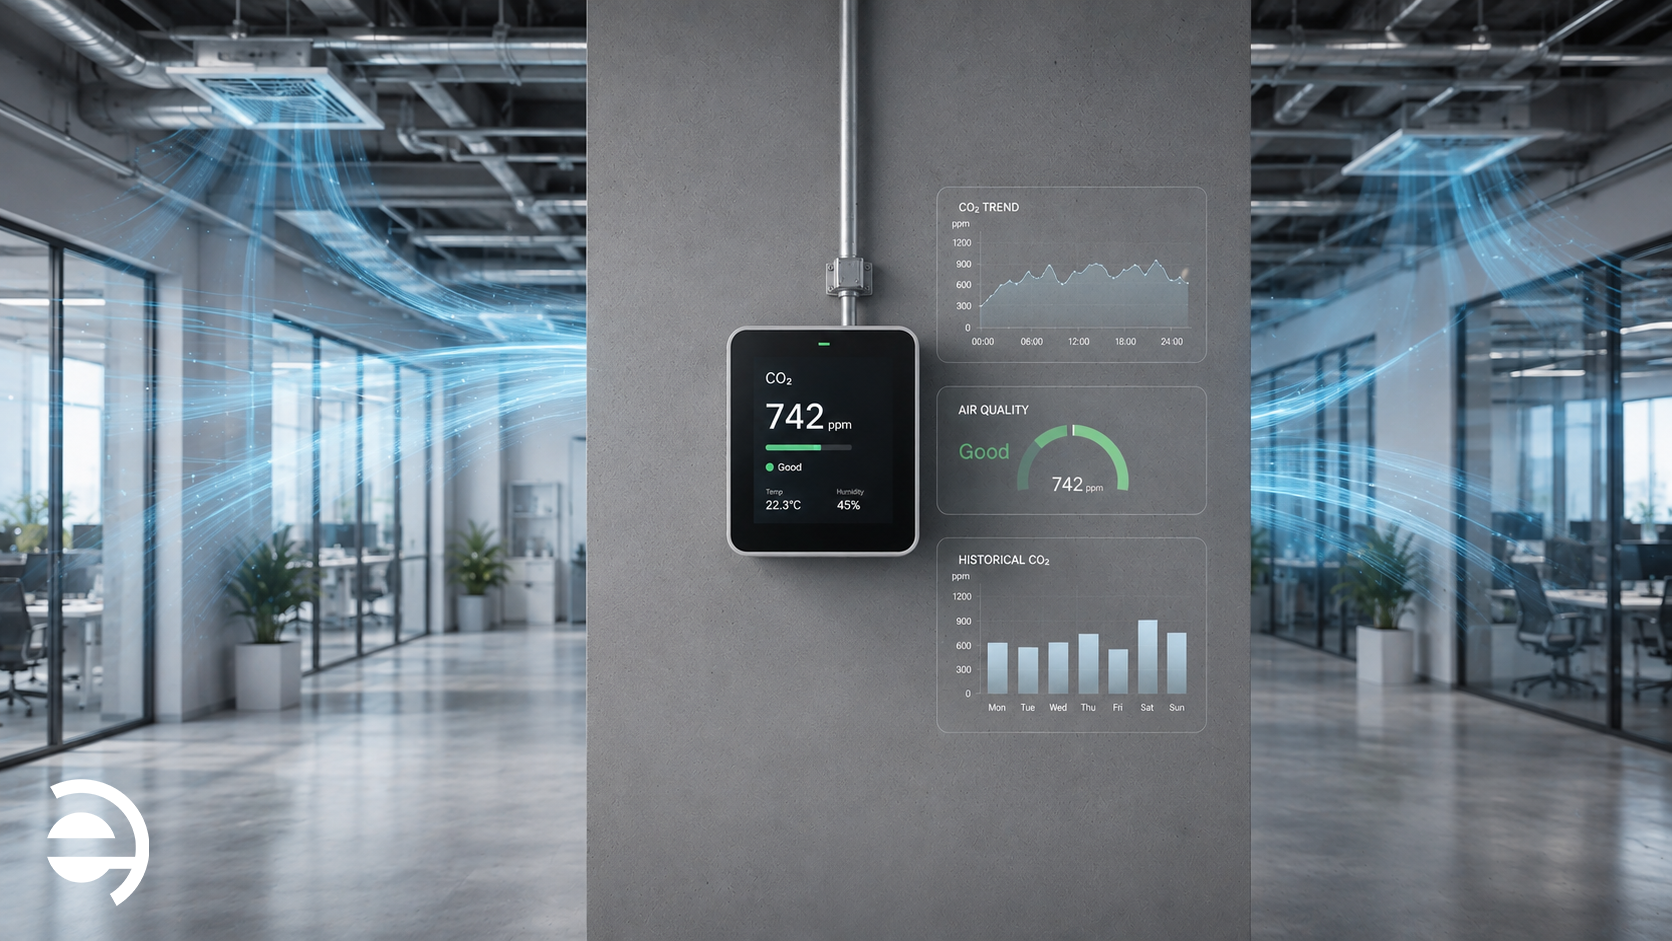
    A CO₂ sensor measures the concentration of carbon dioxide in the air, normally expressed in parts per million (ppm).

    Carbon dioxide is naturally present in the atmosphere, but indoor concentrations can rise when people occupy an enclosed space. Humans continuously produce CO₂ through respiration, meaning occupied rooms can show noticeable changes in concentration when ventilation is insufficient relative to occupancy.

    What-Does-CO₂-Sensor-Measure

    A CO₂ sensor therefore provides useful information about how indoor air conditions are changing.

    How CO₂ Sensors Detect Carbon Dioxide

    Many modern CO₂ sensors use non-dispersive infrared (NDIR) technology.

    NDIR sensors work by detecting how infrared light is absorbed by CO₂ molecules. Because carbon dioxide absorbs infrared radiation at specific wavelengths, the sensor can estimate the concentration of CO₂ in the surrounding air.

    This approach is widely used for indoor environmental monitoring because it provides continuous measurements without requiring chemical reagents.

    The sensor then makes the measured value available to the monitoring system, where it can be recorded, visualized, and compared with configured thresholds.

    Why Does CO₂ Matter for Indoor Air Quality?

    CO₂ is not a complete measurement of indoor air quality. A room can have acceptable CO₂ levels while still containing other pollutants or contaminants.

    However, CO₂ is a useful operational indicator because its concentration is strongly influenced by occupancy and ventilation.

    When CO₂ levels repeatedly increase during occupied periods, facility teams can investigate whether:

    • Ventilation is adequate for the number of occupants
    • HVAC systems are operating as expected
    • Air exchange is occurring effectively
    • Certain rooms experience recurring ventilation problems
    • Occupancy patterns are affecting indoor conditions

    This makes CO₂ monitoring particularly useful in offices, classrooms, meeting rooms, healthcare facilities, commercial buildings, and other occupied spaces.

    How Air Quality Monitoring IoT Turns CO₂ Data Into Useful Information

    A standalone CO₂ sensor provides a reading. An IoT monitoring system provides context.

    In a connected air quality monitoring system, the typical data flow includes three layers:

    1. Sensor Layer

    Sensors installed throughout a building measure CO₂ and other environmental parameters.

    Measurements can be collected at defined intervals, creating a continuous record of changing conditions.

    2. Connectivity Layer

    The sensor communicates with a gateway or monitoring infrastructure using an appropriate communication protocol.

    For industrial and building environments, protocols such as Modbus can provide a practical way to connect environmental sensors to a centralized system.

    3. Monitoring Layer

    The collected information is presented through software dashboards, historical charts, alerts, or reports.

    This allows facility teams to move from isolated measurements to trends.

    For example, instead of knowing that a meeting room currently has a certain CO₂ concentration, a monitoring platform can show how the concentration changed throughout the entire workday.

    This distinction is one of the main advantages of air quality monitoring IoT.

    What Can Continuous CO₂ Monitoring Reveal?

    A single CO₂ reading provides limited information. Continuous monitoring creates a much clearer picture of how a space behaves.

    For example, a monitoring system may reveal that:

    • CO₂ consistently rises during afternoon meetings
    • A particular office has higher readings than similar rooms
    • Levels remain elevated after occupancy decreases
    • Ventilation changes correspond with changes in CO₂
    • Certain rooms experience recurring air quality patterns
    • Environmental conditions vary significantly between different areas of the same building

    These patterns can be difficult to identify through occasional manual measurements.

    Continuous air quality monitoring IoT therefore supports a shift from reactive investigation to data-based observation.

    CO₂ Monitoring and Building Operations

    CO₂ data can also be useful when evaluating building operations.

    HVAC systems are designed to maintain appropriate environmental conditions, but actual building performance can vary depending on occupancy, system configuration, maintenance, and usage.

    When CO₂ measurements are combined with temperature and humidity data, facility teams can gain a broader understanding of indoor conditions.

    For example, a building manager could compare:

    • CO₂ levels with occupancy patterns
    • CO₂ levels with HVAC schedules
    • Temperature with ventilation changes
    • Humidity with seasonal conditions
    • Different rooms or zones over the same period

    This does not mean that CO₂ alone determines whether a building has good or poor air quality. Instead, it provides another measurable data point for understanding how the building operates.

    What Other Sensors Should Be Combined With CO₂?

    A more complete indoor environmental monitoring strategy usually combines several parameters rather than relying on CO₂ alone.

    Useful measurements may include:

    Temperature

    Temperature affects occupant comfort and can also help identify HVAC performance issues.

    Humidity

    Relative humidity can influence comfort, condensation risk, and the overall indoor environment.

    Particulate Matter

    PM2.5 and other particulate measurements can provide information about airborne particles that CO₂ sensors cannot detect.

    VOCs and Other Gases

    Depending on the building and application, additional gas sensors can help identify other potential sources of indoor air contamination.

    Combining these measurements creates a more comprehensive environmental dataset than any single sensor can provide.

    How to Choose a CO₂ Monitoring System

    When selecting an IoT-based CO₂ monitoring solution, the sensor itself is only one part of the decision.

    How-to-Choose-CO₂-Monitoring-System

    Consider the following factors:

    • Measurement technology: Understand how the sensor detects CO₂ and the expected measurement range.
    • Accuracy: Check the stated measurement accuracy and operating conditions.
    • Sampling and update rate: Consider how frequently readings need to be collected.
    • Communication protocol: Ensure compatibility with the existing monitoring architecture.
    • Installation environment: Wall-mounted, duct-mounted, and other configurations may suit different applications.
    • Data access: Confirm that measurements can be stored, visualized, and analyzed over time.
    • Integration: Consider whether the system can connect with existing BMS, SCADA, EMS, or other platforms.
    • Scalability: A suitable system should support expansion from one monitored room to multiple buildings or facilities.

    For organizations already using industrial monitoring infrastructure, Modbus-based sensors can be particularly practical because environmental measurements can be integrated into a broader monitoring architecture. Elidiso’s existing guide on [what a Modbus sensor is and why it matters for industrial monitoring] can provide additional technical context.

    Why Continuous Air Quality Monitoring Matters

    Indoor air quality is dynamic. A building that appears well-ventilated in the morning may behave differently when occupancy increases later in the day.

    Periodic measurements can provide useful snapshots, but continuous monitoring provides the timeline between those snapshots.

    By using connected CO₂ sensors and other environmental sensors, organizations can:

    • Observe indoor conditions continuously
    • Identify recurring environmental patterns
    • Investigate ventilation-related changes
    • Compare different rooms or zones
    • Build historical environmental records
    • Support data-driven facility management
    • Integrate environmental data with wider IoT monitoring systems

    Ultimately, air quality monitoring IoT provides a way to turn invisible environmental changes into measurable data.

    CO₂ sensors are not a complete solution for every aspect of indoor air quality, but they are an important component of a broader monitoring strategy. When connected to a reliable IoT architecture, their measurements can help facility teams understand how buildings actually operate and where environmental conditions may require closer attention.

    For organizations developing connected environmental monitoring systems, Elidiso’s Modbus-based sensor architecture provides a way to bring parameters such as CO₂, temperature, humidity, and other environmental measurements into a centralized monitoring environment.

  • Environmental Monitoring in the Middle East: Challenges, and IoT Solutions

    Environmental Monitoring in the Middle East: Challenges, and IoT Solutions

    The Middle East is one of the most environmentally demanding operating regions in the world. Extreme heat, intense humidity along coastal zones, pervasive dust, and some of the highest industrial energy consumption rates globally create conditions that push facilities, equipment, and operations to their limits. For organizations which require managing factories, warehouses, data centers, logistics hubs, or commercial buildings across the GCC, environmental monitoring in the Middle East is not simply a best practice, but it is increasingly a regulatory requirement and a direct operational necessity.

    For any organization with operations in the region, understanding the specific demands of environmental monitoring and Middle East conditions, from extreme heat and humidity to increasingly stringent regulatory requirements, is the foundation for building a resilient, compliant facility. This article examines the key environmental challenges, the regulatory landscape across Oman, UAE, and Saudi Arabia, and how industrial IoT solutions are helping organizations in Oman, the UAE, Saudi Arabia, and beyond gain the real-time visibility they need to protect assets, ensure compliance, and operate efficiently.

    Why Environmental Monitoring in the Middle East Is Uniquely Challenging

    Facilities in the GCC and broader Middle East face environmental conditions that are significantly more demanding than those in temperate regions. Understanding these challenges is the starting point for designing an effective environmental monitoring system.

    Extreme Heat

    Summer temperatures regularly exceed 45°C across the Arabian Peninsula, with ground-level and industrial surface temperatures often reaching 60–70°C. For sensitive equipment, electronics, HVAC systems, server infrastructure, and manufacturing machinery, sustained heat exposure accelerates degradation, increases failure rates, and drives up energy consumption. A robust remote monitoring system that tracks temperature continuously across all critical zones is the first line of defense against heat-related equipment failure.

    High Humidity and Coastal Corrosion

    Along the Gulf Coast, from Muscat to Dubai, Abu Dhabi, and Doha, relative humidity can exceed 90% during summer months. High moisture levels accelerate corrosion of metal components, degrade electrical insulation, promote mold growth in controlled environments, and compromise the accuracy of unprotected sensors. Facilities in coastal industrial zones must monitor humidity continuously to protect both assets and product quality.

    Dust and Particulate Matter

    Sandstorms and persistent airborne dust are a defining environmental challenge across the region, particularly in Oman, Saudi Arabia, and the UAE. Dust infiltration damages cooling systems, clogs filtration units, coats solar panels, and contaminates cleanrooms and pharmaceutical facilities. Air quality monitoring IoT sensors that track PM2.5 and PM10 particulate levels in real time give facilities early warning of dust events and enable automated responses before damage occurs.

    Energy Consumption and Peak Load Pressure

    The GCC has some of the highest per-capita energy consumption rates in the world, driven largely by cooling demand. As governments across the region push toward diversification and sustainability targets, UAE Net Zero 2050, Saudi Vision 2030’s energy efficiency components, Oman’s 2040 sustainability roadmap, facilities face growing pressure to monitor, report, and reduce energy consumption. Smart facility management platforms powered by IoT sensors are becoming the primary tool for meeting these obligations.

    The Regulatory Landscape Driving Environmental Monitoring Demand

    Regulation is now one of the primary drivers of environmental monitoring Middle East investment. The pace of legislative change across the GCC means organizations can no longer treat monitoring as optional and those that have not yet built a continuous environmental monitoring in the Middle East at a pace that was not seen five years ago. Organizations operating across the GCC now face binding compliance requirements that make continuous environmental monitoring not optional but mandatory.

    UAE — Federal Environmental Law and GHG Reporting

    The UAE passed Federal Decree-Law No. 11 on the Reduction of Climate Change Effects in August 2024, which took effect in May 2025. The law mandates that all public and private entities — including those in Free Zones report on their greenhouse gas emissions and submit emissions-reduction plans. Full compliance was required by May 2026, with penalties of up to AED 2 million for non-compliance. For industrial facilities, this makes continuous emissions and environmental monitoring a legal obligation.

    Saudi Arabia — RCER-2025 and NCEC Reporting

    Saudi Arabia’s Royal Commission Environmental Regulations (RCER-2025) significantly tightened environmental compliance requirements for industrial operators. Continuous Emissions Monitoring Systems (CEMS) are now mandatory for stacks above 2 MW thermal input, and hourly automated data transmission to the NCEC’s central platform is required, manual reporting is no longer accepted. Environmental permit applications are now fully digitalized, with processing times reduced by 40% through the NCEC platform.

    Oman — MECA and Mandatory ESG Disclosure

    Oman’s Ministry of Environment and Climate Affairs (MECA) governs environmental permitting and compliance for industrial facilities. Since January 2025, the Muscat Stock Exchange has mandated sustainability reporting for all listed companies, requiring disclosure against 30 GRI-aligned environmental, social, and governance metrics. For facilities operating in Oman’s industrial zones, Sohar, Duqm, Salalah, IoT solutions Oman that automate environmental data collection and reporting are increasingly essential for meeting these obligations efficiently.

    GCC-Wide Air Quality Initiatives

    In January 2025, the GCC launched a joint air quality monitoring network spanning 36 cities across the region, using real-time sensors and satellite data to track particulate matter and pollutants. This regional initiative signals a clear direction: governments across the Gulf are investing in environmental data infrastructure, and the expectation is that industrial facilities will follow with their own internal air quality monitoring IoT systems to align with national and regional standards.

    How Industrial IoT Solutions Address Middle East Environmental Challenges

    The growth of industrial IoT solutions in the Middle East reflects the scale of the environmental challenge. The Middle East and Africa IoT sensors market is projected to add USD 7.81 billion between 2026 and 2031, driven by government investment, multinational industrial participation, and the region’s accelerating digital transformation. The environmental sensor market in the Middle East and Africa alone is forecast to reach USD 222.7 million by 2034.

    Modern environmental monitoring systems built on IoT technology address the region’s specific challenges through three core capabilities:

    Real-Time Visibility Across All Parameters

    Industrial IoT sensors deployed across a facility continuously measure the parameters that matter most in a Middle Eastern operating environment: temperature, humidity, CO₂ concentration, particulate matter (PM2.5/PM10), air pressure, light levels, and energy consumption. Data is transmitted in real time to a centralized remote monitoring system dashboard, giving operations teams instant visibility across every zone, from server rooms and cleanrooms to warehouse floors and outdoor equipment yards.

    This real-time visibility eliminates the blind spots that manual monitoring creates and in a region where a two-hour temperature excursion can damage a batch of pharmaceuticals or trigger equipment failure, the ability to detect and respond immediately is not a luxury but an operational requirement.

    Automated Alerting and Threshold Management

    Effective environmental monitoring in the Middle East means the system does not just record data, it acts on it. IoT monitoring platforms allow operations teams to define threshold values for every parameter, triggering automated alerts, via SMS, email, or dashboard notification, when readings exceed acceptable ranges. During a sandstorm, for example, a sudden spike in PM10 readings triggers an alert to close ventilation intakes. A temperature anomaly in a server room triggers an immediate escalation before equipment reaches critical levels.

    Compliance Documentation and Audit Trails

    For facilities operating under UAE, Saudi, and Omani environmental regulations, the ability to generate audit-ready compliance reports is as important as the monitoring itself. Modern smart facility management platforms automatically log all sensor readings with timestamps, generate exception reports when thresholds are breached, and produce the structured data exports required for regulatory submission, eliminating the manual data collection burden that previously consumed significant time from operations and compliance teams.

    Environmental Monitoring Middle East: Key Industry Applications

    IoT solutions GCC deployments for environmental monitoring span a wide range of industrial and commercial sectors:

    • Oil and gas facilities — Monitoring temperature, gas concentration, and air quality across upstream and downstream operations for both operational efficiency and HSE compliance
    • Data centers — Continuous temperature and humidity monitoring to maintain uptime SLAs in facilities where cooling failure has immediate business impact
    • Pharmaceutical and food production — Environmental compliance monitoring for cleanrooms, cold storage, and regulated production areas under GCC health authority requirements
    • Logistics and warehousing — Temperature and humidity monitoring across large warehouse footprints, particularly for temperature-sensitive goods in transit or storage
    • Commercial real estate and smart buildings — Energy monitoring, HVAC performance tracking, and indoor air quality management for mixed-use commercial developments
    • Renewable energy — Performance and environmental monitoring for solar installations, where dust accumulation and temperature affect panel efficiency across the region’s rapidly expanding solar portfolio

    Choosing an Environmental Monitoring Middle East Solution: What to Look For

    Not all environmental monitoring systems are designed for the conditions found in the Middle East. When evaluating industrial IoT sensors and monitoring platforms for GCC deployment, operations and procurement teams should prioritize:

    • Operating temperature range — Sensors must be rated for ambient temperatures of 55°C or above for outdoor or non-climate-controlled applications
    • IP rating — IP65 or higher for dust and moisture resistance in industrial environments; IP67 or IP68 for outdoor coastal deployments
    • Communication protocol reliability — Wired protocols such as Modbus RTU over RS-485 offer superior noise immunity in electrically demanding industrial environments
    • Scalability — The system should handle expansion from a single facility to multi-site operations across the GCC without requiring a platform change
    • Regulatory reporting capability — Built-in report generation that meets the data format and frequency requirements of UAE, Saudi, and Omani regulatory bodies
    • Local support — Given the region’s specific compliance environment, having a supplier with local technical expertise and after-sales support is essential

    How Elidiso Supports Environmental Monitoring Middle East Operations

    Elidiso specializes in industrial IoT solutions for environmental and operational monitoring across the Middle East, Africa, and Europe. Based in Oman, with experience serving clients across the GCC, our environmental monitoring systems are designed for the region’s specific conditions, from the heat and humidity of coastal Gulf facilities to the dust and temperature extremes of inland industrial sites.

    Our integrated stack, industrial-grade IoT sensors, Modbus gateways, and EMS monitoring software, gives facility managers, operations directors, and sustainability teams a complete remote monitoring system that covers every parameter, every zone, and every compliance requirement their operations face.

    Whether you need an environmental monitoring Middle East solution for a single facility or a multi-site network across the GCC, Elidiso has the hardware, software, and regional expertise to deliver. environmental monitoring system for a new facility, upgrading a legacy setup to meet current regulatory requirements, or expanding coverage across multiple sites, Elidiso has the hardware, software, and regional expertise to deliver.

    Contact our team today to discuss your requirements and receive a solution tailored to your Middle East operations.

  • Card Printer Consumables: A Complete Guide to Ribbons, and Card Stock

    Card Printer Consumables: A Complete Guide to Ribbons, and Card Stock

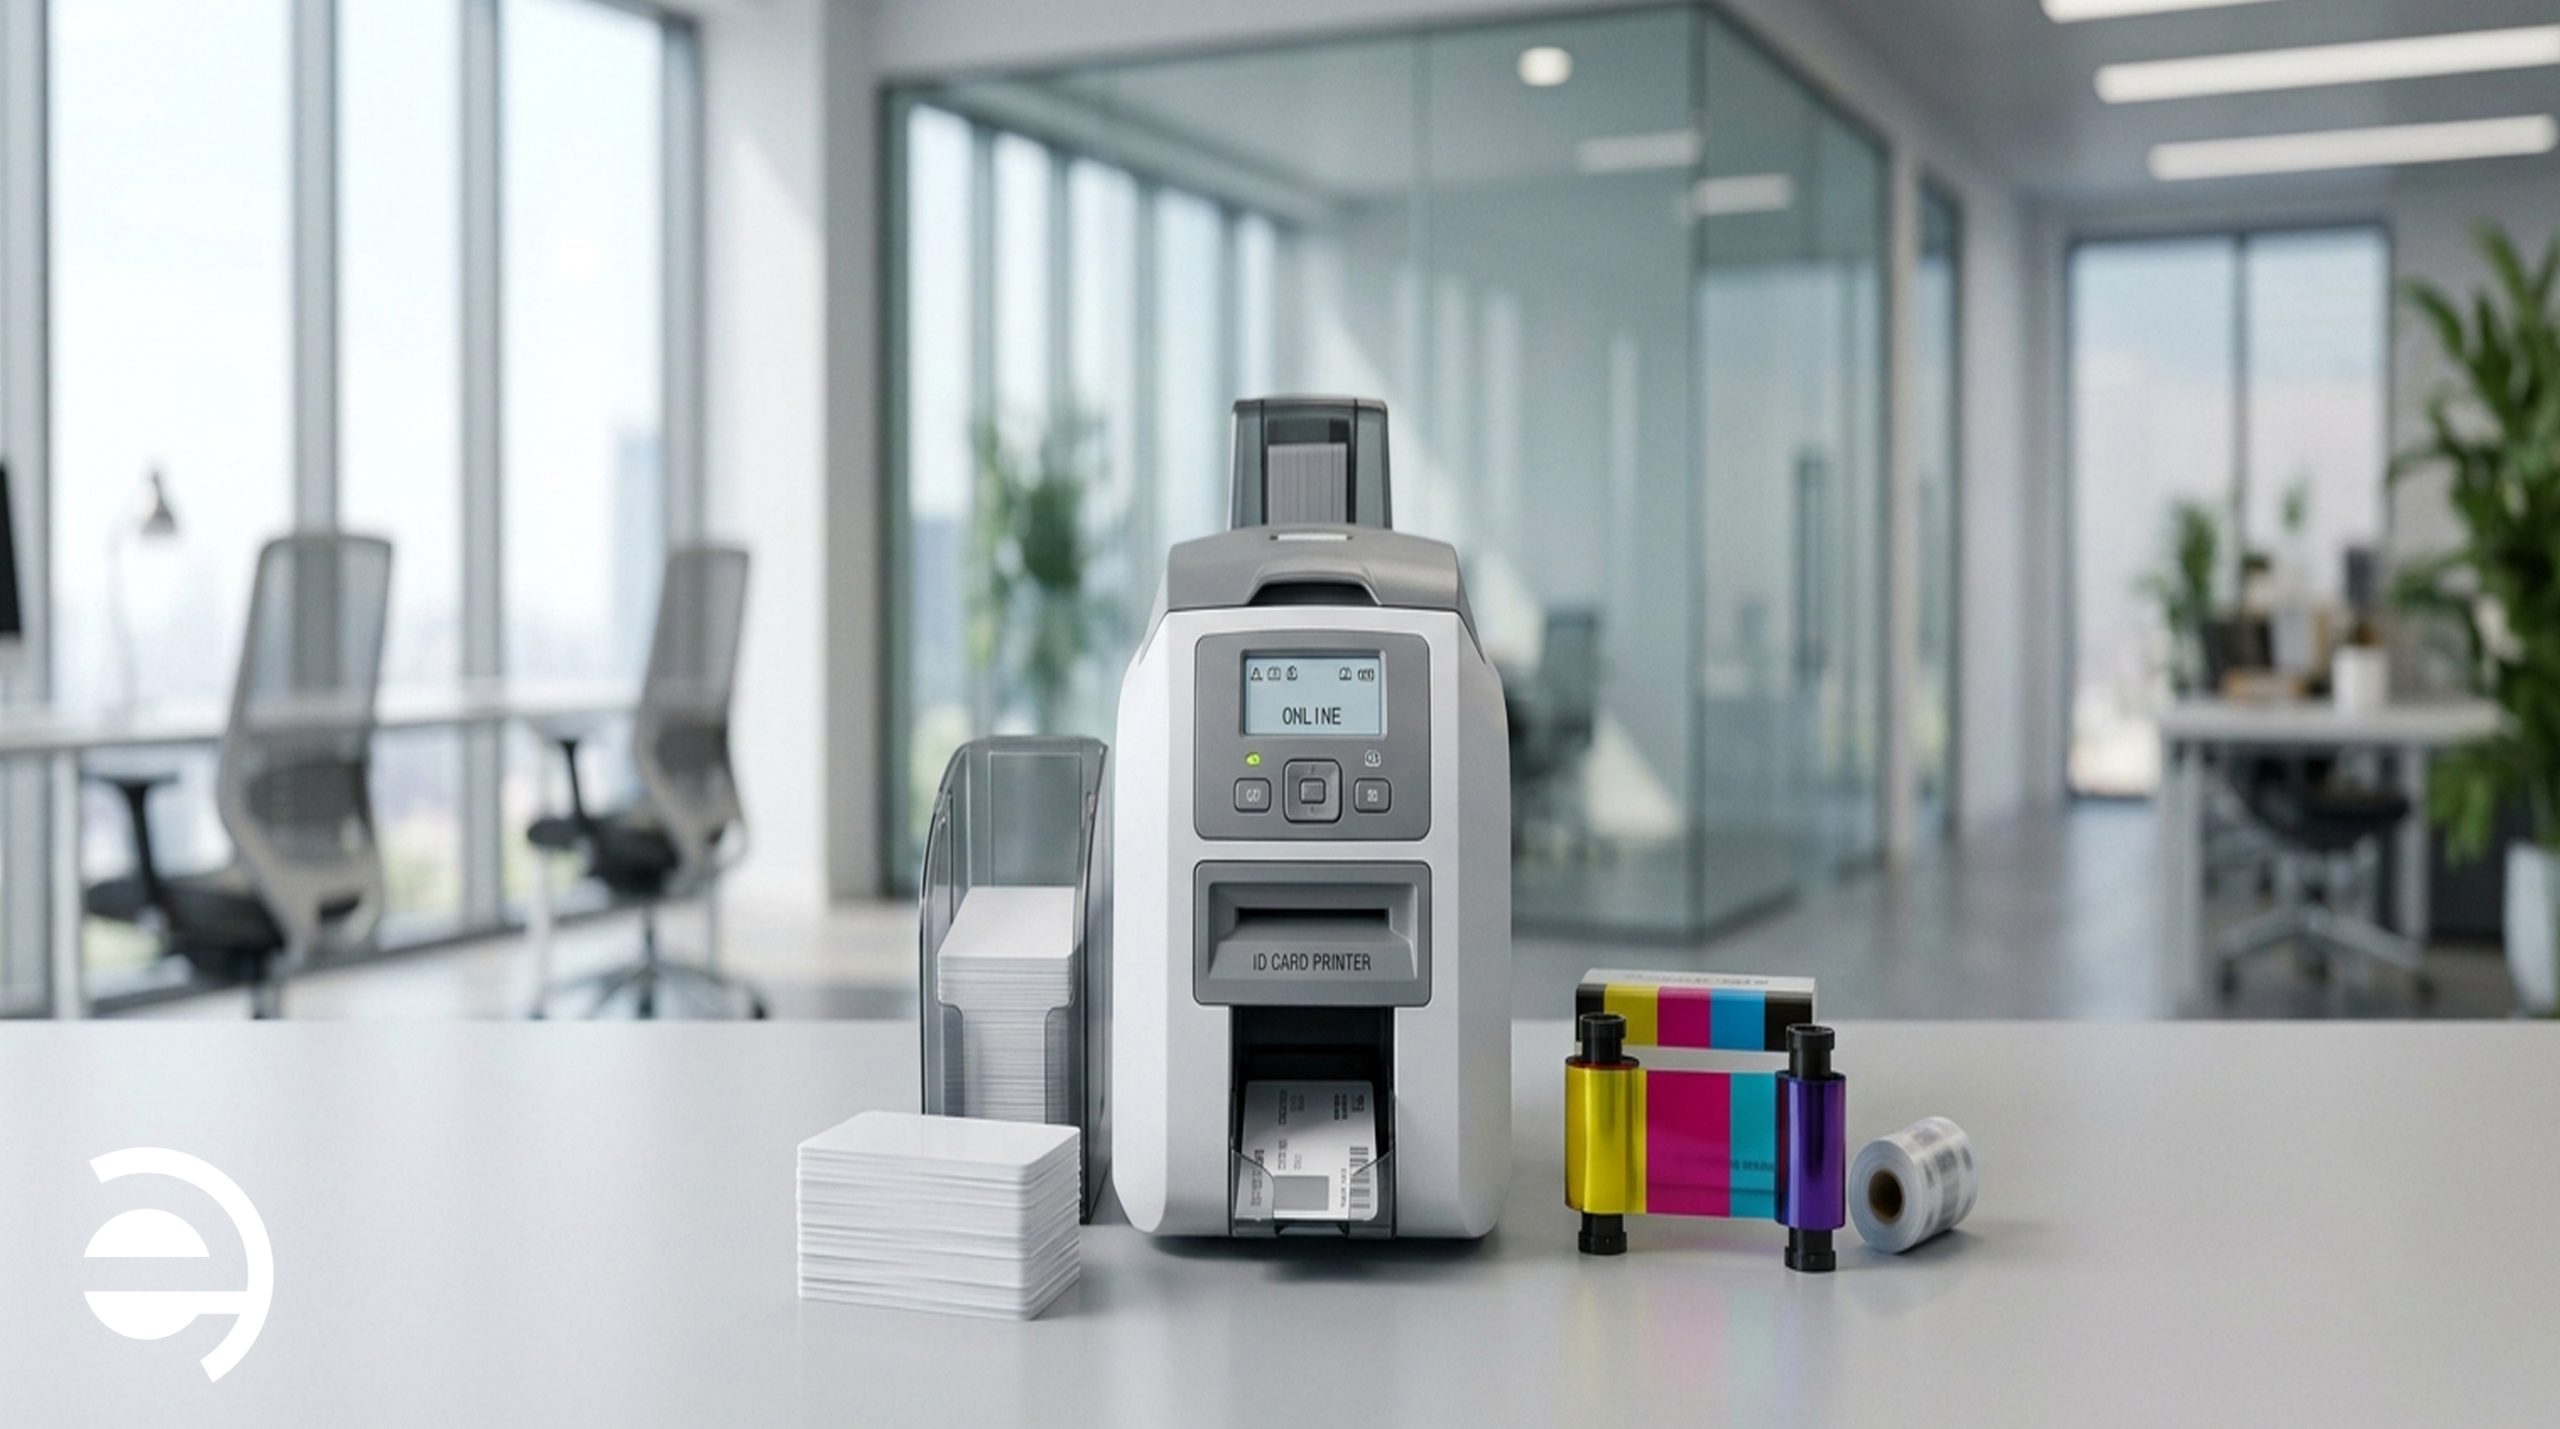
    Running a professional ID card printing program involves more than just the hardware. Understanding card printer consumables, including ribbons, overlaminates, and blank card stock, is essential for maintaining print quality, durability, and security. Yet for many HR teams and procurement managers, these materials receive little attention until a printing issue interrupts daily operations.

    This guide explains what card printer consumables are, how they affect the printing process, and what organizations should consider when managing an ID card printing program.

    What Are Card Printer Consumables?

    Card printer consumables are the materials used during the printing process that need to be replenished as cards are produced. The three main categories are:

    • Ribbons: Contain the ink or dye used to transfer images, text, and other information onto cards.
    • Overlaminates: Protective films applied over printed cards to improve durability and, depending on the type, provide additional security features.
    • Blank card stock: The physical cards onto which photographs, names, logos, and other information are printed.

    Choosing unsuitable consumables for a particular printer or application can lead to inconsistent print quality, printing errors, or compatibility problems. Understanding these materials helps organizations make informed decisions about their card printing requirements.

    Card Printer Ribbons: What You Need to Know

    Ribbons are among the most important card printer consumables, directly affecting print quality, color accuracy, and the appearance of identification cards.

    Ribbons are among the most important card printer consumables, directly affecting print quality, color accuracy, and the appearance of identification cards.

    Different ribbon configurations serve different purposes. Full-color ribbons are commonly used for employee badges, student ID cards, and membership cards featuring photographs, logos, and other graphics. Monochrome ribbons are suitable for simpler designs that primarily contain text or single-color elements, while specialized ribbons can support additional requirements, such as UV security printing.

    The appropriate ribbon depends on the printer model, printing technology, card design, and intended application. Using compatible consumables and following the manufacturer’s specifications helps maintain consistent output and reliable equipment operation.

    For a detailed comparison of YMCK, YMCKO, YMCKOK, KO, and UV ribbons, read our dedicated guide to card printer ribbon types.

    Overlaminates: Why They Matter More Than Most Teams Realize

    An overlaminate is a thin protective film applied over a printed card using compatible equipment. Depending on its composition and design, it can help protect the card against surface wear, scratching, and fading while introducing additional security features.

    Two common types are clear and holographic overlaminates.

    Clear Overlaminate

    A clear overlaminate provides a transparent protective layer without significantly changing the card’s visual appearance. It can help reduce the effects of routine handling and preserve the printed design over time.

    This type of protection can be useful for employee badges, student identification cards, and membership cards that are frequently handled. The actual improvement in card lifespan depends on the card material, printing technology, laminate specifications, and conditions of use.

    For organizations that issue cards expected to remain in circulation for extended periods, a compatible clear overlaminate may be worth considering.

    Holographic Overlaminate

    A holographic overlaminate incorporates a visible security pattern, such as a logo, geometric design, or repeating motif, that changes appearance when viewed from different angles.

    This feature can make unauthorized reproduction more difficult and help distinguish genuine credentials from basic copies. Custom holographic patterns can also reinforce an organization’s visual identity.

    Holographic overlaminates are particularly relevant to applications with additional credential-security requirements. However, they should be used alongside appropriate issuance controls and access management procedures rather than treated as a complete security solution on their own.

    Blank Card Stock: Choosing the Right Material

    Blank card stock is an essential part of an ID card printing program because the material affects print quality, durability, and compatibility with the printing system. The main options include PVC, composite, and polycarbonate cards.

    • PVC cards (CR-80): A widely used standard for identification and membership programs. The CR-80 format measures approximately 85.6 × 54 mm and is commonly used for employee IDs, student cards, and membership credentials. Compatibility depends on the printer and card specifications.

    • Composite cards (PVC/PET blend): Combine PVC with PET to provide greater dimensional stability and improved resistance to certain forms of heat and bending. They can be suitable for demanding applications, provided the selected card is compatible with the printing technology.
    • Polycarbonate cards: Used for applications requiring durable, high-security credentials. Certain polycarbonate cards support laser engraving, allowing information to be incorporated into the card structure in ways that make alteration more difficult.

    The appropriate card material depends on the intended application, expected lifespan, printing technology, and any encoding requirements.

    Using card stock that is unsuitable for a particular printer can contribute to card jams, inconsistent print quality, or unnecessary wear on rollers and other components. Manufacturer compatibility specifications should therefore be checked before selecting card materials.

    How to Match Consumables to Your Printer and Use Case

    Choosing suitable card printer consumables involves evaluating three main factors: printer compatibility, printing volume, and security requirements.

    1. Your Printer Model

    Card printer ribbons are not universal. Manufacturers and individual printer models may use different ribbon cartridges, formats, and supported materials.

    Before selecting a ribbon or overlaminate, verify compatibility with the specific printer model and printing technology. The same consideration applies to blank cards, particularly when using specialized materials or cards with embedded technology.

    Using incompatible consumables can result in printing errors, poor output, or equipment problems. Following the manufacturer’s specifications and maintenance recommendations helps support consistent printing performance.

    2. Your Card Volume

    The number of cards an organization produces affects how frequently consumables must be replaced and how printing operations should be managed.

    High-volume programs may benefit from compatible high-capacity ribbons that reduce the frequency of ribbon changes. Smaller programs may prioritize straightforward operation and the ability to print cards when needed.

    For example, schools and universities may experience increased demand during enrollment periods, while gyms and fitness clubs may need to print membership cards throughout the year. Business centers may require employee and visitor cards as tenants and staff change.

    Planning for these patterns can help organizations manage printing schedules, replacement requirements, and maintenance more effectively.

    3. Your Security Requirements

    The appropriate consumables depend on the purpose of the card and the level of protection required.

    For routine identification, a compatible full-color ribbon and suitable card stock may be sufficient. Applications that require additional durability or visual security may benefit from compatible overlaminates, specialized card materials, or supported security-printing features.

    Organizations should evaluate the sensitivity of the information printed on the card, how the credential will be used, and whether it must work with an access control or authentication system.

    The objective is to select a configuration that meets the actual requirements of the application without adding unnecessary complexity.

    How Elidiso Supports ID Card Printing and Card Printer Maintenance

    Elidiso provides ID card printing services and card printer maintenance for organizations that need professional identification cards and support for their existing printing equipment.

    Our services cover a range of identification requirements across different sectors:

    • Schools and universities: Student ID cards, staff identification cards, and replacement cards.
    • Gyms and fitness clubs: Membership cards for member identification and registration.
    • Business centers: Employee, tenant, and visitor identification cards.
    • Companies and other organizations: Employee badges and other organizational identification cards.

    Alongside card printing, Elidiso provides card printer maintenance to help organizations address equipment issues and maintain reliable printing operations. Appropriate maintenance can help identify potential problems, reduce avoidable downtime, and support consistent print quality.

    Understanding consumable compatibility is also important when maintaining existing card printing equipment. Organizations should follow the specifications for their particular printer and use suitable materials to help avoid preventable printing problems.

    Whether you need identification cards for students, employees, members, or visitors, or require maintenance for an existing card printer, Elidiso can help with your card printing requirements.

    Contact Elidiso to discuss your ID card printing needs or inquire about card printer maintenance for your organization.

    Final Thoughts

    Managing a professional ID card printing program requires attention to the materials, equipment, and processes involved. Understanding ribbons, overlaminates, and blank card stock helps organizations make informed decisions about print quality, card durability, and security.

    For schools, universities, gyms, business centers, and enterprises, reliable card printing and appropriate printer maintenance support consistent identification processes as organizational needs evolve.

  • What Is a Modbus Sensor and Why It Matters for Industrial Monitoring?

    What Is a Modbus Sensor and Why It Matters for Industrial Monitoring?

    If you have ever explored industrial monitoring systems, you have almost certainly encountered the term Modbus sensor. It appears in product datasheets, system architecture diagrams, and procurement documents across manufacturing, energy, building management, and infrastructure sectors. But what does a Modbus sensor actually do and why does this technology still matter in 2026, decades after it was first introduced?

    This guide explains Modbus in plain terms, what a Modbus sensor is, how it fits into a complete monitoring system, and what facility managers, engineers, and operations teams need to know when evaluating industrial IoT solutions.

    What Is Modbus?

    Modbus is a communication protocol which contains a set of rules that defines how devices exchange data with each other. It was developed in 1979 by Modicon for use in programmable logic controllers (PLCs), making it one of the oldest and most established protocols in industrial automation.

    Despite its age, Modbus remains dominant in industrial environments for a simple reason: it works. It is robust, well-understood, vendor-neutral, and supported by virtually every industrial device manufacturer in the world. When engineers talk about industrial interoperability, Modbus is almost always part of the conversation.

    There are two main variants in active use today:

    • Modbus RTU — Communicates over serial wiring (RS-485 or RS-232). Compact, reliable, and well-suited to industrial environments where wired connections are practical. This is the most widely deployed variant.
    • Modbus TCP — Communicates over standard Ethernet or IP networks. Easier to integrate into modern IT infrastructure and suitable for longer distances and more complex network topologies.

    What Is a Modbus Sensor?

    A Modbus sensor is an environmental or industrial sensor that communicates using the Modbus protocol. Rather than simply outputting a raw analog signal (like a voltage or current), a Modbus sensor transmits structured digital data that can be read, logged, and acted upon by a connected monitoring system.

    Common parameters measured by Modbus sensors include:

    • Temperature — Air, surface, liquid, or soil temperature
    • Humidity — Relative humidity in ambient air or controlled environments
    • CO₂ concentration — Indoor air quality monitoring in offices, warehouses, and industrial facilities
    • Air pressure — Barometric or differential pressure for HVAC and cleanroom applications
    • Particulate matter (PM2.5 / PM10) — Dust and air quality in industrial and urban environments
    • Light levels — Illuminance monitoring for energy management and workplace compliance
    • Voltage and current — Electrical monitoring for energy consumption tracking

    Each sensor sits on a shared communication line, called a Modbus bus, and is assigned a unique address. When the master device (typically a gateway or controller) polls the bus, each sensor responds with its current reading. This polling architecture is simple, deterministic, and extremely reliable.

    How Does a Modbus Sensor Fit Into a Monitoring System?

    Understanding a Modbus sensor means understanding the system it sits within. A typical industrial environmental monitoring architecture has three layers:

    Layer 1 — Sensors

    Each Modbus sensor is deployed at the point of measurement, inside a factory, on an HVAC unit, in a server room, across a warehouse floor, or around a building perimeter. Each sensor continuously measures its parameter and holds the latest reading in memory until it is requested.

    Layer 2 — Gateway

    A Modbus gateway collects data from multiple sensors on the bus by polling each one in sequence. It aggregates the readings and forwards them, which is typically over Ethernet or a cellular connection, to a central monitoring platform. The gateway is the bridge between the field-level sensor network and the digital management layer above it.

    A single gateway can typically handle dozens of sensors, making it cost-effective to instrument large facilities without running separate wiring or communication infrastructure for each device.

    Layer 3 — EMS / Monitoring Software

    The Energy Management System (EMS) or monitoring software receives data from the gateway, stores it, visualizes it in dashboards, generates alerts when readings exceed defined thresholds, and produces reports for compliance, auditing, or operational review.

    This three-layer architecture, sensors, gateway, software, is the core stack that Elidiso delivers as an integrated solution. All three components come from a single vendor, which means they are designed to work together, tested together, and supported together.

    Why Choose Modbus Over Other Protocols?

    There are many industrial communication protocols available today, including MQTT, BACnet, PROFIBUS, and OPC-UA; so why does Modbus remain so widely used? Several reasons:

    Universal compatibility

    Modbus is supported by virtually every industrial device on the market. If you are integrating sensors from multiple manufacturers into one system, Modbus is usually the lowest-friction option.

    Proven reliability

    Modbus RTU over RS-485 wiring is highly resistant to electrical noise and interference, a critical advantage in factories, power plants, and other electrically demanding environments where other communication methods struggle.

    Low complexity

    Modbus is straightforward to configure and troubleshoot. Unlike some newer protocols, it does not require complex middleware, licensing, or specialized expertise. This keeps installation and maintenance costs manageable.

    Long cable runs

    RS-485 wiring supports cable runs of up to 1,200 meters, making Modbus practical for large facilities where sensors are spread across significant distances.

    No vendor lock-in

    Because Modbus is an open standard, you are not tied to a single manufacturer’s ecosystem. Sensors, gateways, and software from different vendors can coexist on the same Modbus network, which gives procurement teams flexibility and negotiating leverage.

    What Are the Limitations of Modbus?

    A balanced evaluation requires acknowledging where Modbus has constraints:

    • Polling-based architecture — Data is collected when the gateway requests it, not pushed in real time. For most environmental monitoring applications, polling intervals of a few seconds are more than adequate. For applications requiring sub-second response, other protocols may be more suitable.
    • Limited native security — The original Modbus protocol was designed for closed industrial networks and does not include built-in encryption or authentication. When deployed over IP networks, additional network security measures are required.
    • Scalability ceiling — Very large networks with hundreds of sensors may require careful architecture to avoid polling bottlenecks. Gateway selection and network segmentation become important at scale.

    For the vast majority of industrial environmental monitoring applications, facilities management, energy monitoring, air quality, cold storage, cleanrooms, the Modbus sensor remains a manageable, well-understood, and proven choice.

    Who Uses Modbus Sensors?

    The Modbus sensor is used across a wide range of industries and applications, wherever reliable, wired environmental data collection is needed:

    • Manufacturing plants — Monitoring temperature, humidity, and air quality across production floors to protect product quality and worker safety
    • Data centers and server rooms — Tracking temperature and humidity to prevent equipment overheating and maintain uptime SLAs
    • Commercial buildings — HVAC monitoring, energy consumption tracking, and indoor air quality management
    • Pharmaceutical and food facilities — Environmental compliance monitoring for cleanrooms, cold storage, and regulated production areas
    • Infrastructure and utilities — Monitoring substations, water treatment facilities, and distribution networks

    Elidiso’s Modbus Sensor Solutions

    Elidiso’s core IoT monitoring product line is built on Modbus, specifically the ELSO.NMxx series of Modbus sensors, which measure environmental parameters including temperature, humidity, CO₂, air pressure, particulate matter, and light levels.

    Our sensors connect to Elidiso’s Modbus gateways and feed data directly into our EMS monitoring software, giving facility teams a complete, integrated view of their environmental conditions from a single platform, with no integration complexity and no multi-vendor troubleshooting.

    Key advantages of Elidiso’s Modbus sensor solutions:

    • Industrial-grade build quality for demanding environments
    • Flexible deployment — wall-mounted, duct-mounted, or panel-installed configurations
    • Scalable from a single room to a multi-building campus
    • Full integration between sensors, gateway, and EMS software — all from one supplier
    • Local technical support and after-sales service across the Middle East, Africa, and Europe

    Contact Elidiso today to discuss your facility’s environmental monitoring requirements and find out how the right Modbus sensor solution can give your operations the visibility and control they need.

  • What Is a Digital Twin? A Practical Guide for Industrial and Enterprise Teams

    What Is a Digital Twin? A Practical Guide for Industrial and Enterprise Teams

    Imagine being able to monitor, test, and optimize a piece of industrial equipment, or an entire factory, without ever touching the physical asset. That is exactly what digital twin technology makes possible. And in 2026, it has moved well beyond a buzzword: it is becoming a foundational tool for enterprises competing in an increasingly data-driven world.

    This guide explains what a digital twin is, how it works, where it is used, and why it matters for organizations operating in industrial, manufacturing, and infrastructure sectors.

    What Is a Digital Twin?

    A digital twin is a real-time virtual replica of a physical object, system, or process. It is continuously synchronized with its real-world counterpart through data from IoT sensors, and it mirrors the state, behavior, and performance of that asset in a digital environment.

    The concept was first introduced in manufacturing and aerospace, where engineers needed a way to simulate asset behavior without disrupting operations. Today, digital twins are used across industries ranging from smart cities and energy to logistics and healthcare.

    According to IBM, the digital twin market is expected to grow from USD 24.5 billion in 2025 to USD 259.3 billion by 2032, driven by rising demand for predictive intelligence and operational efficiency.

    How Does a Digital Twin Work?

    A digital twin system has three core components working together:

    1. The Physical Asset

    This is the real-world entity being modeled; a machine, a production line, a cold storage warehouse, a fleet of vehicles, or even an entire building. Sensors are attached to this asset to continuously capture data.

    2. The Data Layer

    IoT sensors collect real-time data on parameters such as temperature, pressure, vibration, speed, energy consumption, or location. This data is transmitted, typically via industrial protocols or cloud connectivity, to the digital model.

    3. The Digital Model

    The virtual model receives the live data feed and updates continuously to reflect the current state of the physical asset. Engineers and operators can interact with this model to monitor performance, run simulations, identify anomalies, and test changes, all without touching the real asset.

    What Can You Do With a Digital Twin?

    Digital twins unlock capabilities that traditional monitoring systems simply cannot offer:

    • Real-time monitoring: View the live status of assets from any location, with instant visibility into performance and anomalies.
    • Predictive maintenance: Detect early signs of equipment degradation before failures occur, reducing unplanned downtime and maintenance costs.
    • Simulation and testing: Model the impact of changes, new configurations, or stress conditions in the virtual environment before applying them to the real asset.
    • Process optimization: Identify bottlenecks, inefficiencies, and energy waste across entire production or logistics systems.
    • Root cause analysis: Replay historical data to understand why a failure occurred and how to prevent recurrence.

    Enterprises that deploy digital twins consistently report strong returns. A 2025 Hexagon survey found that 92% of companies using digital twins report returns above 10%, with more than half reporting a return on investment of at least 20%.

    Digital Twins in Industrial IoT

    The connection between digital twins and Industrial IoT (IIoT) is fundamental. Without IoT sensors providing continuous data, a digital twin would be a static model, useful for design, but not for operations. It is the live data stream from connected devices that transforms a model into a dynamic, intelligent replica.

    In an IIoT environment, digital twins act as a convergence layer between raw sensor data and higher-level analytics and decision-making. They do not just show what is happening. In fact, they explain why it is happening and help predict what will happen next.

    Key industrial applications include:

    • Manufacturing — Monitoring production lines for quality deviations, energy inefficiency, and equipment wear.
    • Oil and gas — Simulating pipeline conditions and predicting corrosion or pressure failures.
    • Energy — Managing wind turbines, solar arrays, or power grid infrastructure in real time.
    • Logistics — Tracking assets such as forklifts, containers, or refrigerated vehicles across a supply chain.
    • Smart buildings — Optimizing energy consumption, HVAC performance, and occupancy management.

    Digital Twins and Industry 4.0

    Digital twins are widely recognized as one of the core enabling technologies of Industry 4.0, the fourth industrial revolution characterized by cyber-physical systems, smart automation, and data-driven decision-making.

    In a fully connected Industry 4.0 environment, individual digital twins do not operate in isolation. They form networks, communicating with each other, sharing insights, and collectively optimizing an entire ecosystem of assets and processes. This cooperative intelligence is what separates modern digital twin deployments from earlier monitoring systems.

    What Should You Look for in a Digital Twin Solution?

    For industrial and enterprise teams evaluating digital twin technology, the key selection criteria are:

    • Sensor compatibility — Can the platform integrate with your existing IoT hardware and industrial protocols such as Modbus or MQTT?
    • Real-time data throughput — Can it handle your data volume without latency that would compromise operational decisions?
    • Simulation capability — Does it support scenario modeling, not just live monitoring?
    • Scalability — Can it grow from monitoring a single machine to an entire facility or fleet?
    • Integration with existing systems — Does it connect to your ERP, SCADA, or cloud infrastructure?

    How Elidiso Supports Digital Twin Deployments

    At Elidiso, our IoT environmental monitoring solutions provide the sensor infrastructure and connectivity layer that digital twin platforms depend on. Our industrial-grade sensors capture the real-time data streams, temperature, humidity, pressure, air quality, and more, that feed the virtual models and make them accurate, actionable, and trustworthy.

    Whether you are building a digital twin for a single piece of critical equipment or an entire industrial facility, Elidiso’s monitoring hardware and connectivity solutions give you the data foundation you need. Contact our team to discuss how our IoT solutions can support your digital twin strategy.